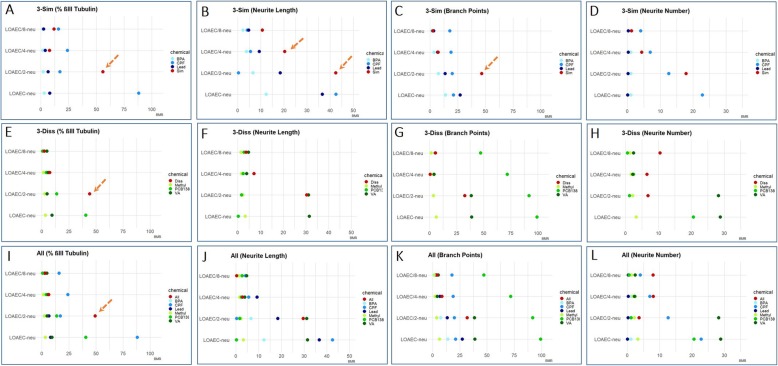
Fig. 10.
Bench mark responses (BMR) for % of neurons and neurite outgrowth. The absolute BMR value of single chemicals, calculated considering their concentrations used in the mixtures ('3-Sim' in a-d, '3-Diss' in e-h, and 'All' in i-l), are plotted and compared with the absolute percentage of response observed experimentally in the mixtures for each neuronal endpoint (normalised to control), respectively: % of β-III-tubulin+ (a, e, i), neurite length (b, f, j), number of branch points/neurite (c, g, k), and number of neurites/neuron (d, h, l). For these endpoints the evaluation of the contribution of single chemicals revealed a response above the 5% threshold (TU > 1), and therefore mixture effects cannot be predicted by this model. However, a combined/potentiated mixture effect can be hypothesized, in the case when the response elicited by the mixture was at least two-folds of magnitude higher than individual chemical contributions, indicated by the orange dashed arrows

