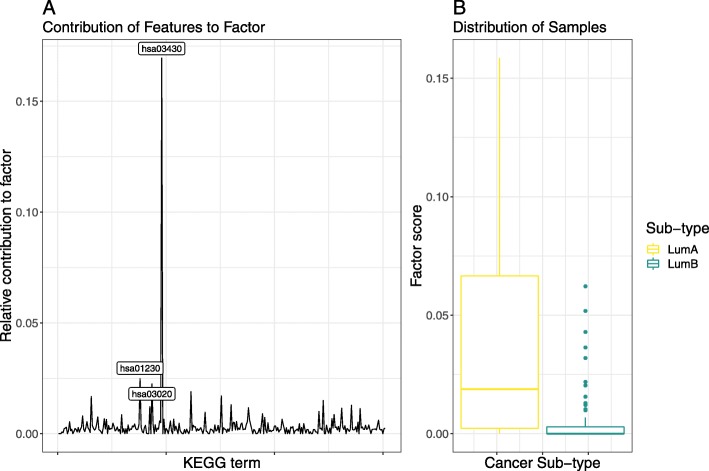
Fig. 6.
This figure presents the results of a non-negative matrix factorisation applied to the KEGG-based importance score matrix. Shown here is the factor which best discriminates between the two breast cancer sub-types. a shows the relative contribution of each KEGG term to the most discriminative factor, with the top 3 components labelled explicitly. b shows a box plot of the distribution of all samples across the composite factor score. This figure is produced using the test set only

