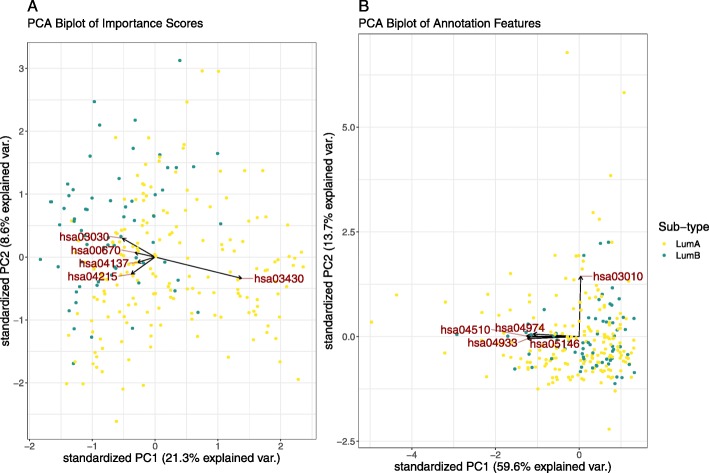
Fig. 7.
This figure shows a PCA biplot of the KEGG-based importance scores (a) and the KEGG annotation features (b), with the top 5 most variable terms labelled explicitly. For the importance scores, we see that the first principal axis describes much of the variance between the breast cancer sub-types, while the second principal axis describes much of the variance within the luminal A sub-type. By super-imposing the features as arrows, we can see which annotations best describe the origin of this variance. This level of structure is not evident when looking at the PCA biplot of the annotation feature space. This figure is produced using the test set only

