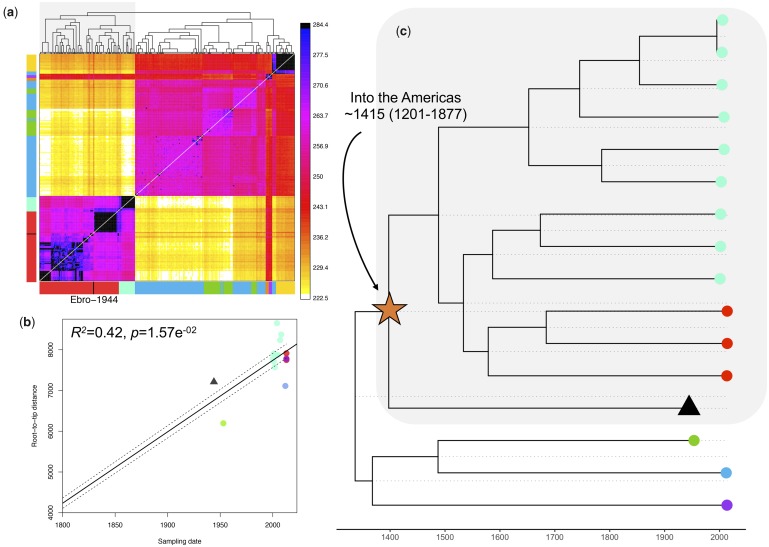
Fig. 3.
(a) CHROMOPAINTER’s inferred counts of matching DNA genome wide that each of the 104 inferred clusters (columns) is painted by each of the 104 clusters (rows). The tree at top shows fineSTRUCTURE’s inferred hierarchical merging of these 104 clusters and the colors on the axes give the continental region and population to which strains in each cluster are assigned. Ebro-1944 is depicted in black and clusters with the sample from Peru and Brazil. (b) Root-to-tip distances of our included Plasmodium vivax strains correlated with the date of isolation. The regression was significant following 1,000 random permutations of sampling date. (c) Tip-dated maximum clade credibility phylogenetic tree obtained with BEAST 2. The mean posterior probability for the time to the most recent common ancestor between the historical European strain and the American strains is indicated. Tips are colored as in fig. 1a.

