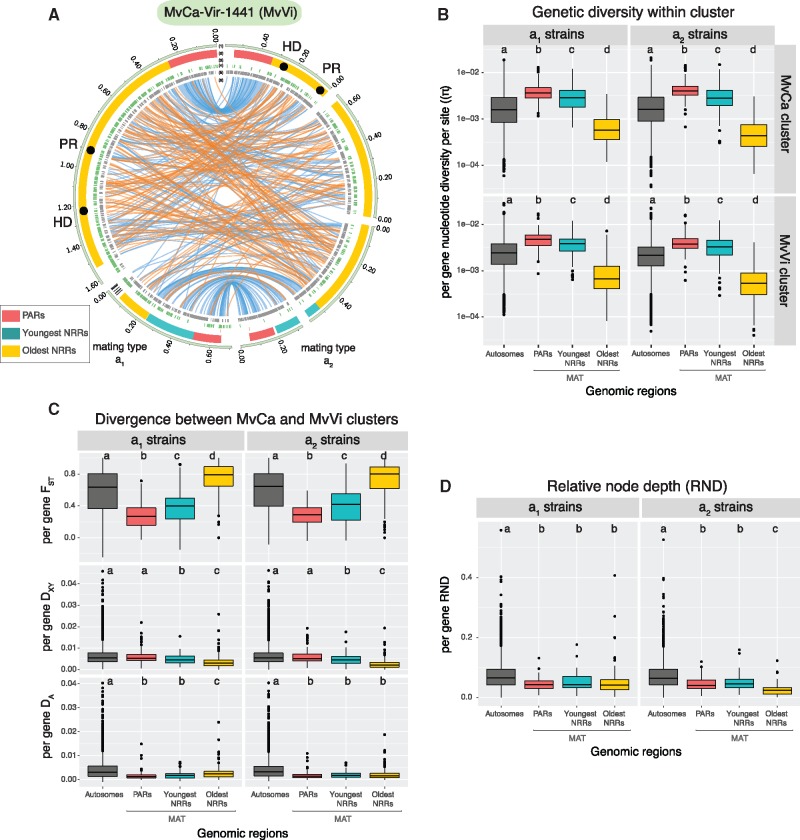
Fig. 3.
Contrasted patterns of genetic diversity and population divergence between mating-type chromosomes and autosomes. (A) Structure and synteny of the a1 and a2 mating-type chromosomes of the MvCa-Vir-1441 strain belonging to the MvVi genetic cluster (i.e., mating-type chromosomes of MvCa-Vir-1441-A1 and MvCa-Vir-1441-A2 assemblies). Tracks represent from the outer to the inner center: 1) contigs, 2) localization of centromeric repeats in black, of the mating-type genes represented by black circles (the HD and pheromone receptor PR genes), and of regions with contrasted levels of recombination (recombining PARs in red, oldest nonrecombining regions (NRRs) in light blue, and youngest NRRs in yellow), 3) subtelomeric repeats in red, 4) transposable elements in green, 5) gene coding sequences in gray, and 6) blue and orange links connecting orthologous regions between assemblies. The link size is proportional to region length and orange links represent inversions. (B) Distribution of per-gene genetic diversity (π) in the MvCa and MvVi genetic clusters. The y-axis was log 10 scaled. (C) Distribution of per-gene net divergence (DA), absolute divergence (DXY), and relative divergence (FST) between the MvCa and MvVi genetic clusters. (D) Distribution of per-gene relative node depth (RND). Statistics distribution is presented separately for the a1 and a2 sequenced haploid genomes, and for the autosomes and three studied regions of the mating-type chromosome (MAT). Different letters indicate significantly different (P value < 0.05) mean values according to pairwise multiple comparisons Wilcoxon tests (P values are presented supplementary table S9, Supplementary Material online). On boxplots, the lower and upper hinges correspond to the first and third quartiles (i.e., 25th and 75th percentiles). The middle hinge corresponds to the median. Dots are outliers.

