Fig. 1.
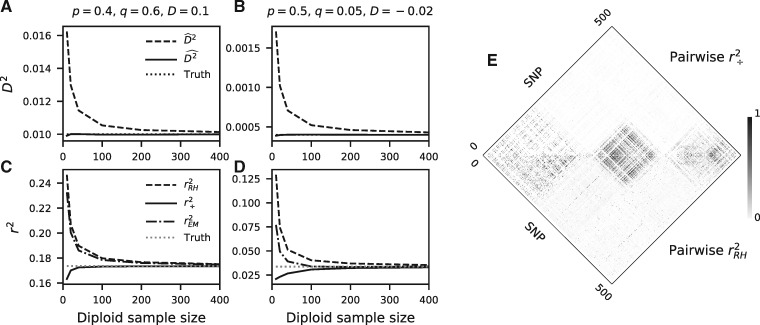
LD estimation. (A, B) Computing D2 by taking the square of the covariance overestimates the true value, whereas our approach is unbiased for any sample size. (C, D) Similarly, computing r2 by estimating r and squaring it (here, via the Rogers–Huff approach, , and the Excoffier–Slatkin EM approach, ) overestimates the true value. Our approach, , does not overestimate the population-level r2, although all estimators show variable biases depending on the underlying haplotype frequencies in the population. Comparisons with additional estimators and frequency configurations are in supplementary figure S1, Supplementary Material online. (E) Pairwise comparison of r2 for 500 neighboring SNPs in chromosome 22 in CHB from 1000 Genomes Project Consortium et al. (2015). (top) and (bottom) are strongly correlated, although displays less spurious background noise.

