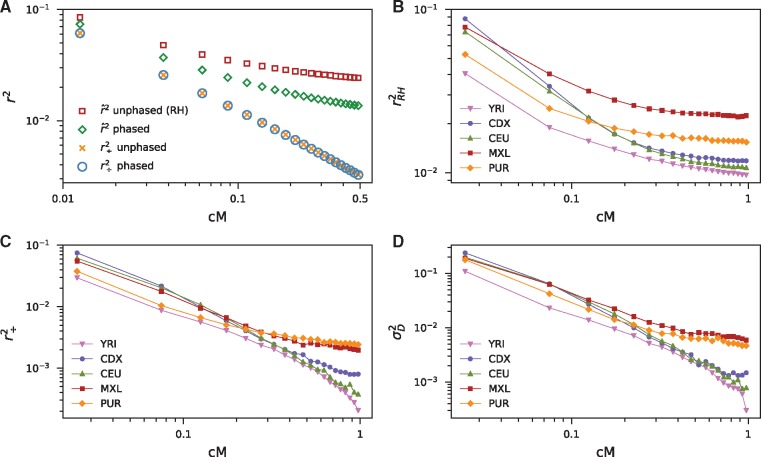
Fig. 2.
Decay of r2 with distance. (A) Comparison between our estimator () and Rogers and Huff (2009) (RH) under steady-state demography. The -curve displays the appropriate decay behavior and is invariant to phasing, whereas the RH estimator gives upward biased r2, and this general approach is sensitive to phasing. Estimates were computed from 1,000 1 Mb replicate simulations with constant mutation and recombination rates (each per base per generation) for n = 50 sampled diploids using msprime (Kelleher et al. 2016). (B) Decay for five populations in 1000 Genomes Project Consortium et al. (2015), including two putatively admixed American populations (MXL and PUR), computed from intergenic regions. (C) Decay for the same populations. (D) Decay of computed as . The decay curves show excess long-range LD in each population, whereas our estimator qualitatively differentiates between populations.

