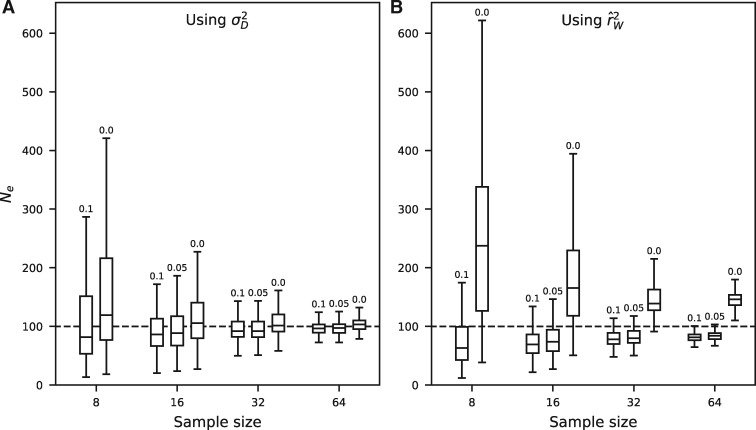
Fig. 4.
Performance of estimation on simulated data. We used fwdpy11 (Thornton 2014) to simulate genotype data for the given sample sizes and Ne = 100 (see Materials and Methods section). Although estimates of Ne using (A) had slightly larger variances than estimates using (B) equations (1) and (2) (computed using NeEstimator [Do et al. 2014]), estimates from were unbiased when using all data and less biased when filtering by MAF, resulting in lower MSE (supplementary table S1, Supplementary Material online).

