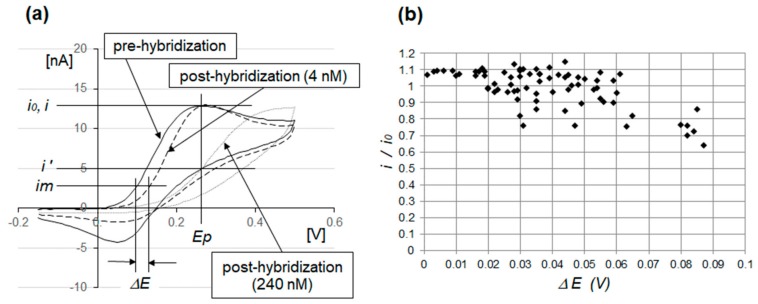
Figure 4.
(a) Cyclic voltammograms (CVs) of gold electrodes modified with a PNA probe (N3) and 6-hydroxy-1-hexanthiol (6-HHT). The solid line indicates the prehybridization curve, while the dotted lines indicate the posthybridization curves at 240 nM and 4 nM of miRNA (R3). At 4 nM, the sensitivity of i/i0 was poor, while the sensitivity of ΔE was high. (b) A 74-pc correlation chart for i/i0 and ΔE is shown, representing when the complementary target miRNA (R3) concentration was 4 nM. Compared to the conventional i/i0 evaluation parameter, ΔE has higher sensitivity and is more suitable for detecting low miRNA concentrations.

