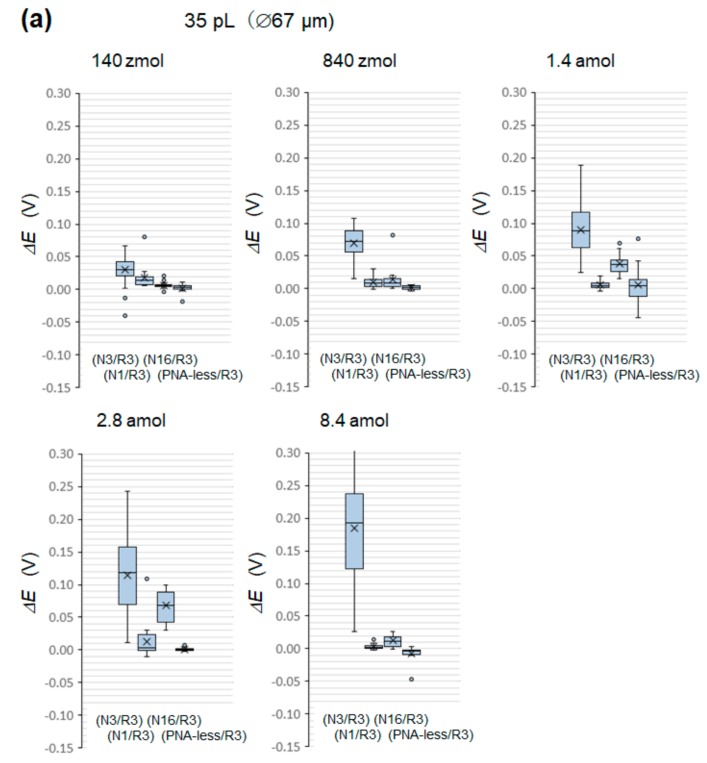
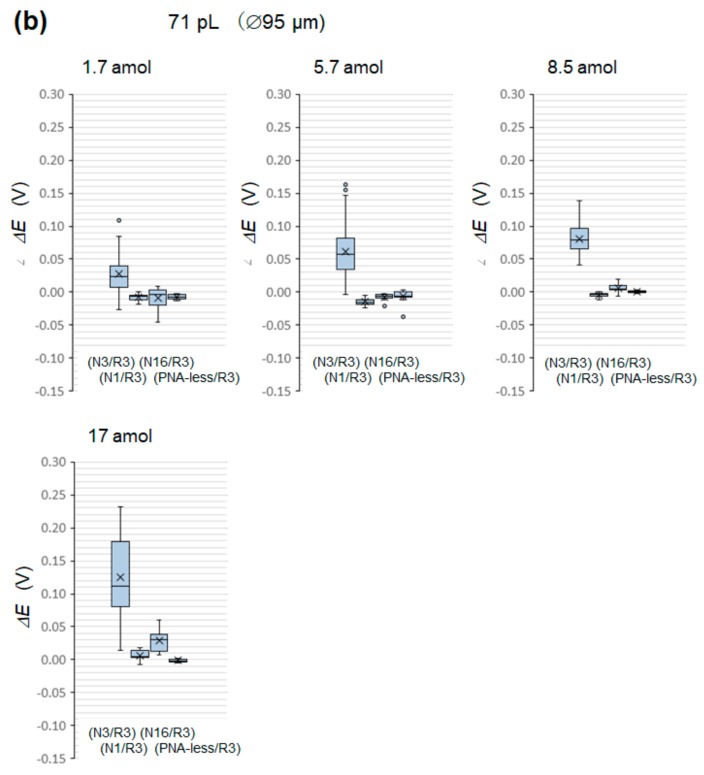
Figure 6.
Boxplots of ΔE detection sensitivity data for (a) 35 pL (∅67 μm) and (b) 71 pL (∅95 μm) at varying molar amounts. In each box plot, (N3/R3) indicates 75 pcs of data of a complementary system, (N1/R3) and (N16/R3) each refer to 15 pcs of data of noncomplementary systems, and (PNA-less/R3) indicates 15 pcs of data of the reference system (to identify the occurrence of the chemisorption of miRNA onto 6-HHT).


