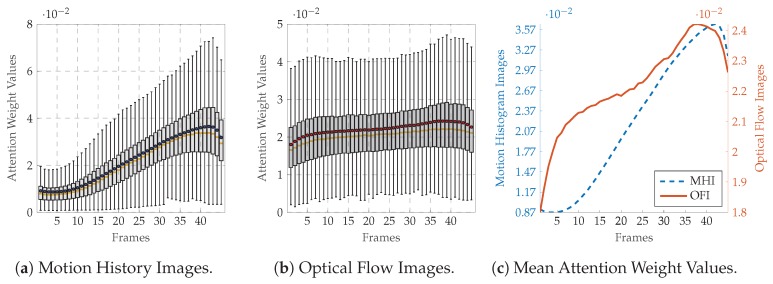
Figure 8.
SenseEmotion Database: Attention network weight values for the classification task . Within each boxplot in (a,b), the mean and the median weight values are depicted respectively with a dot and a horizontal line. In (c), the average weight values are normalised between the maximum average value and the minimum average value to allow a better visualisation of the values distributions.

