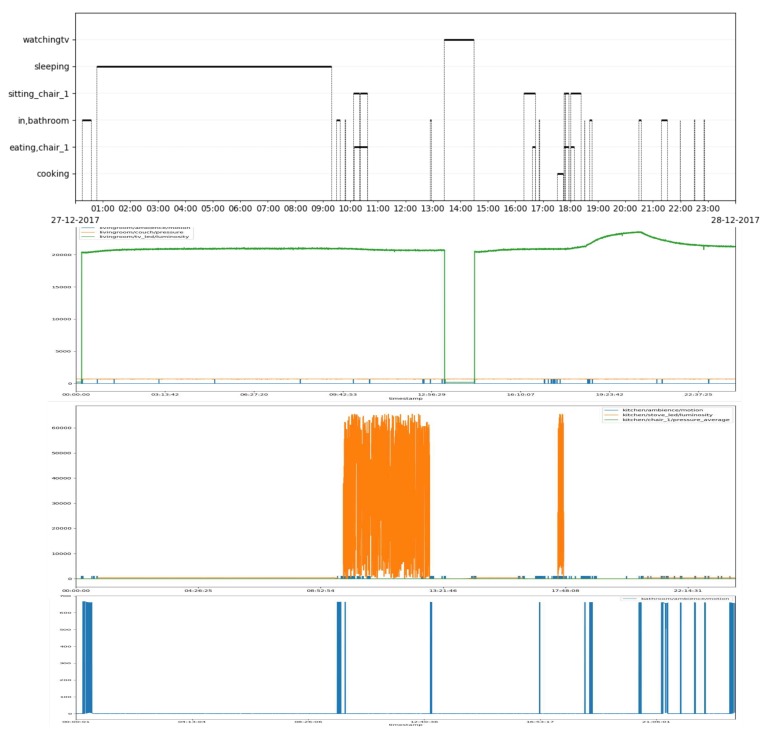
Figure 7.
An example of the data gathered from the campaign: The top row shows the activities as labelled by the user, the second rows shows activation from the sensors in the living room, the third row shows activation from the kitchen, and the last row shows activation from the bathroom. Please note that the TV LED is lit when the TV is off while the oven LED is lit when the over is on. We can see from row 3 that the oven LED is on between 09:00 and 13:00, while the cooking activity has not been labelled, which might indicate that the user turned the oven on by mistake and forgot about it.

