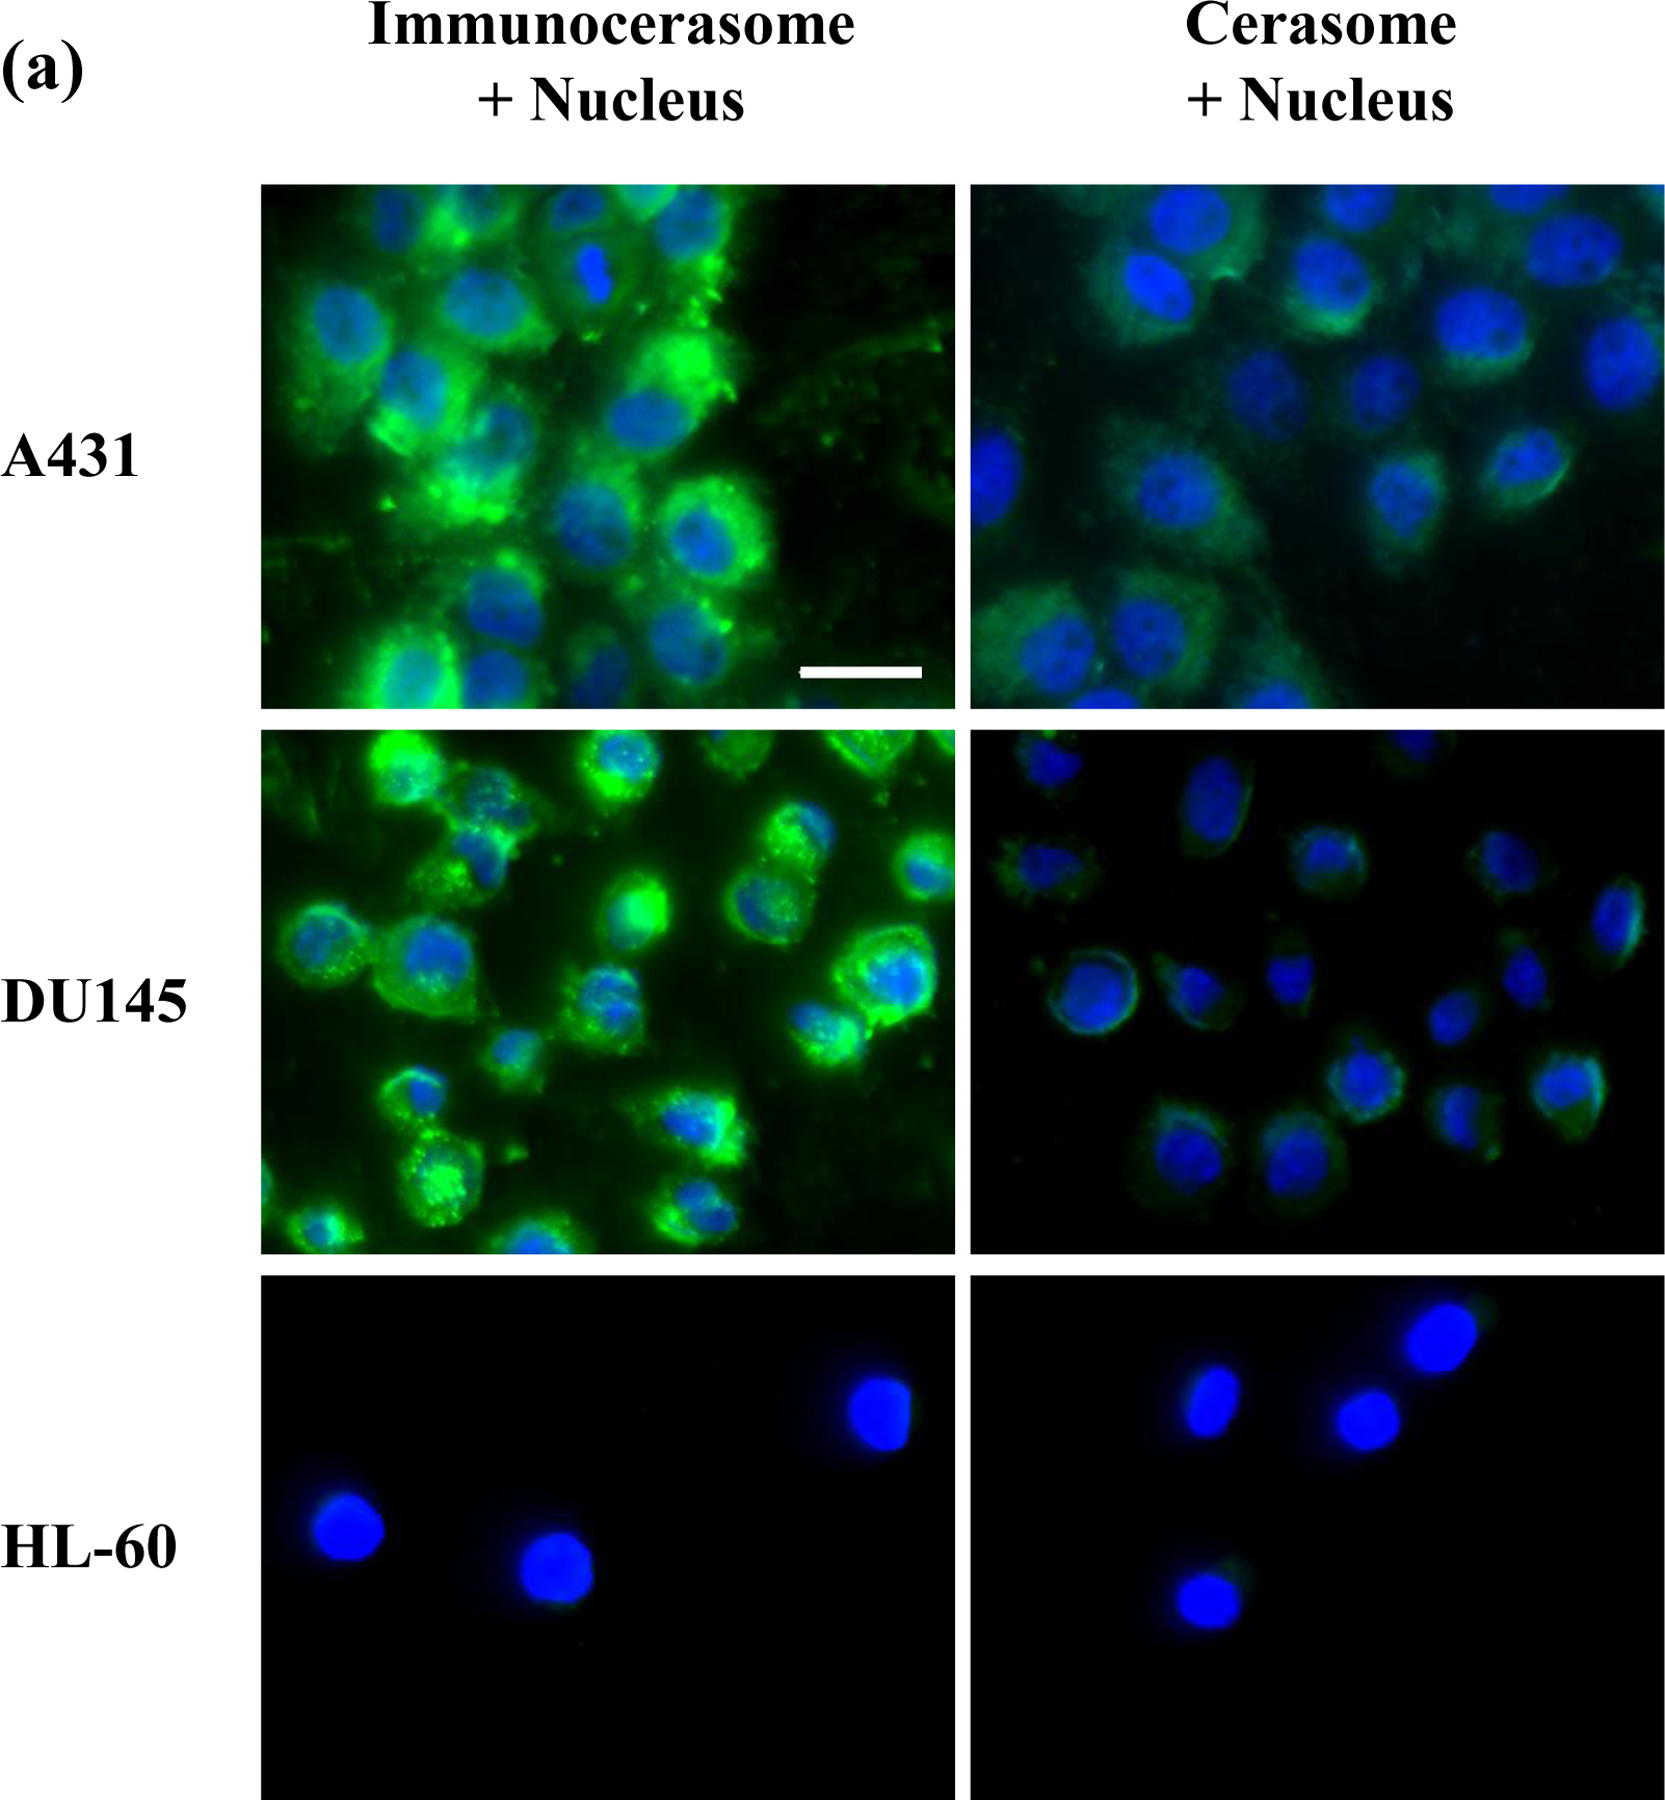
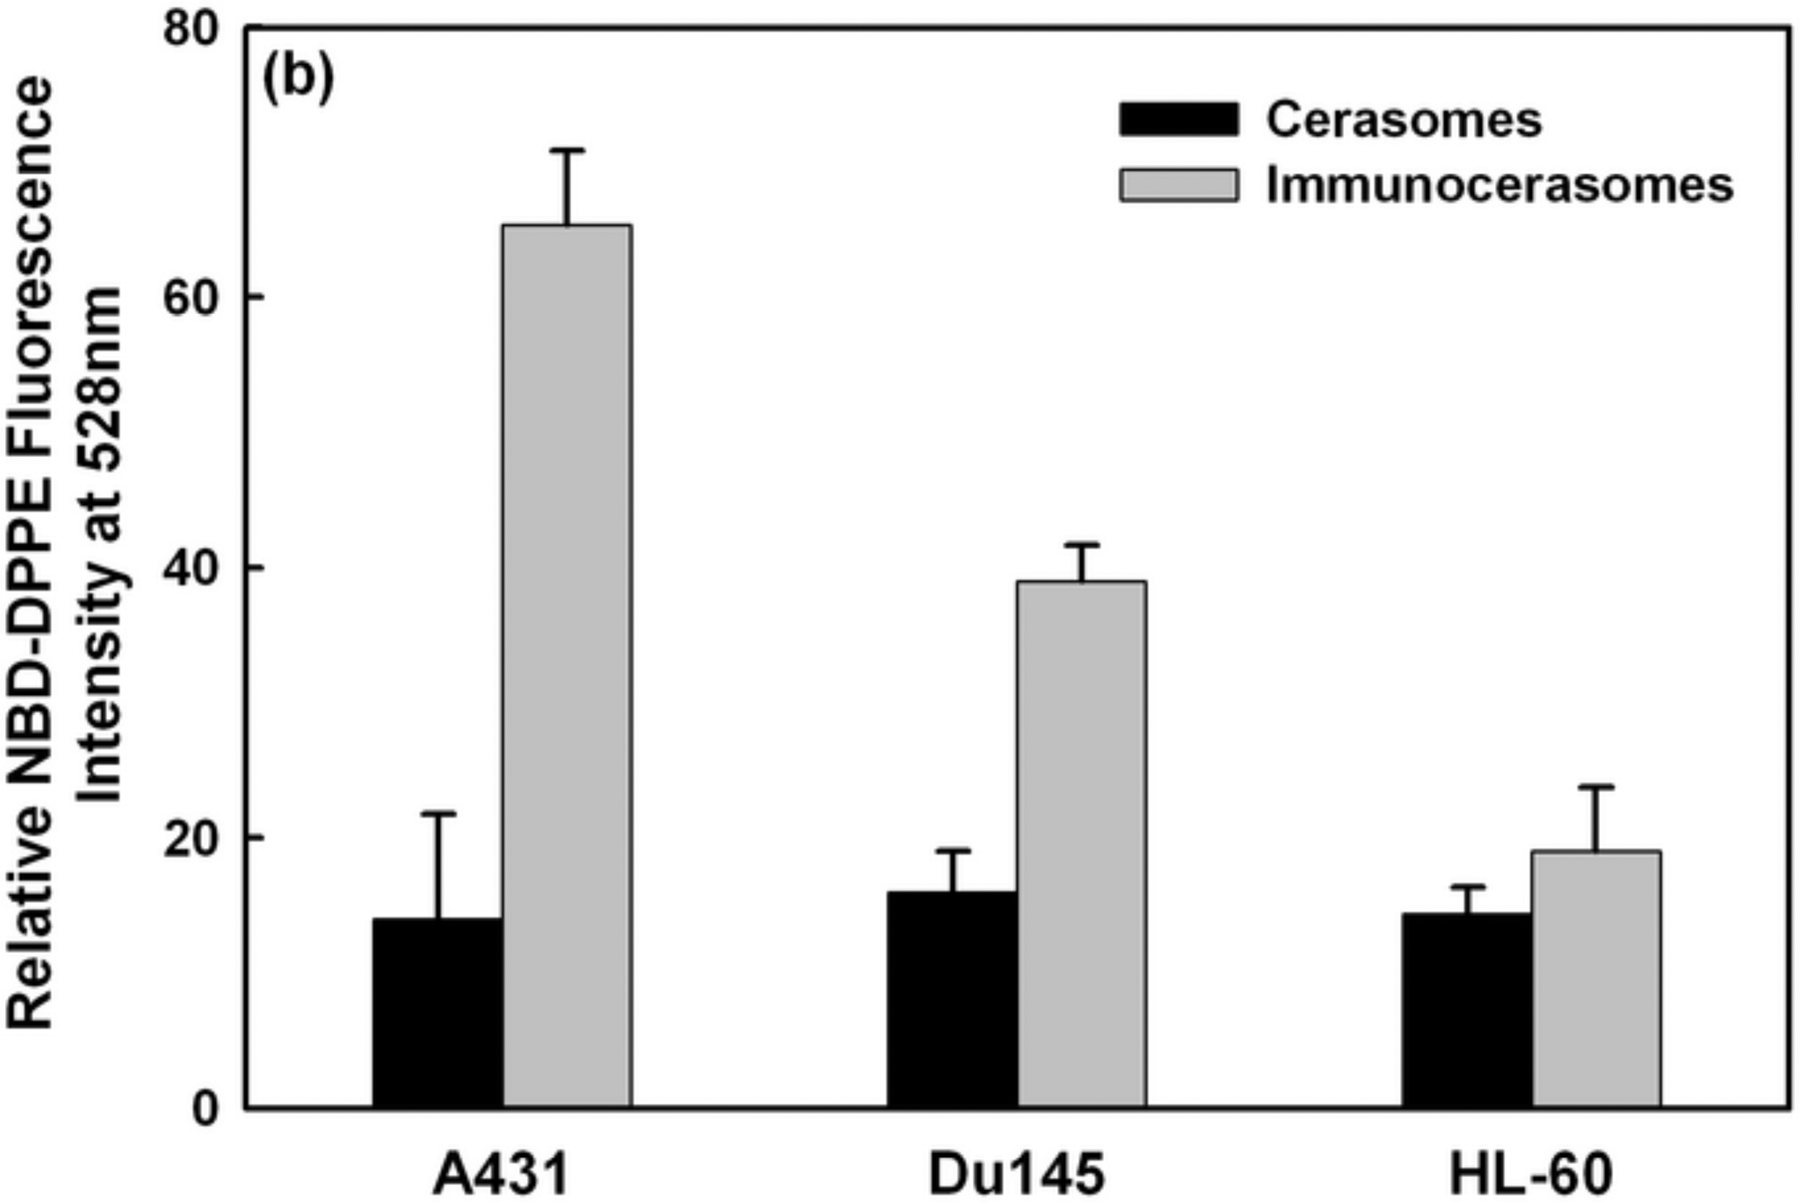
Fig. 3.


Fluorescent imaging analysis (a) and spectrophotometric analysis (b) of the cellular uptake and internalization of immunocerasomes in comparison to the cerasome control. A431, DU145, and HL-60 cells were incubated with immunocerasomes or cerasomes at a lipid concentration of 185 μM for 3 hr. (a) The cells were fixed and stained against nucleus by DAPI (blue), while immunocerasomes and cerasomes were labeled using NBD-DPPE (green). Scale bar: 25 μm (b) The relative amount of internalized immunocerasomes or cerasomes was measured by the NBD-DPPE fluorescence intensity of the cell lysates. The averages and errors were calculated from measurement of three replicate specimens. The p values were calculated to be 0.00059 for the endocytosis of cerasomes vs. immunocerasomes in A431 cells, 0.00031 in DU145 cells, and 0.117 in HL-60 cells, respectively.
