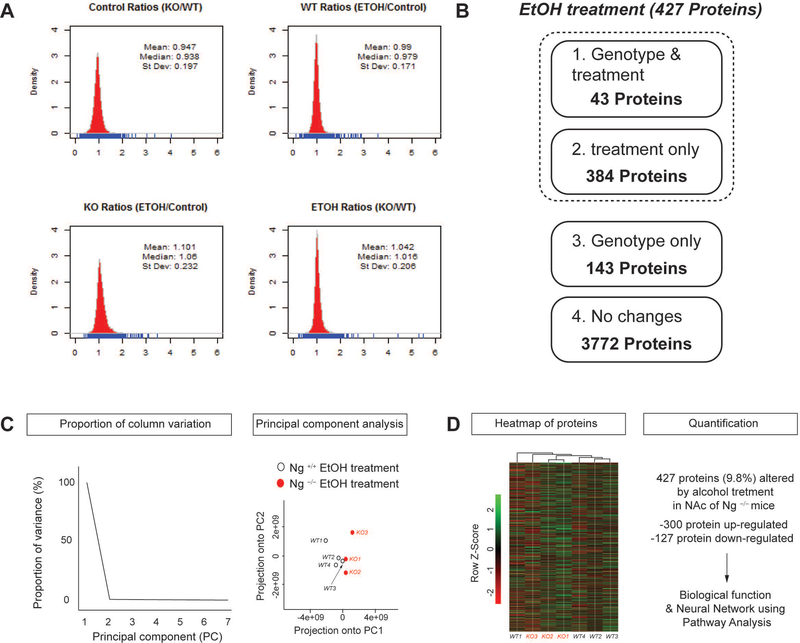
Figure 2.
Bioinformatics analysis for label-free proteomics data. A. Density plot comparison of protein quantification results in response to genotype and alcohol treatment. Mass spectrum intensity from each condition was demonstrated using density plots. B. Pharmacoproteomics analysis in the NAc of Ng−/− mice in response to acute alcohol treatment. 427 proteins were changed in response to alcohol treatment. Among 427 proteins, 43 proteins were changes in both genotypes and alcohol treatment. 143 proteins were changed by genotype only. 3772 proteins were not changed by either genotype or alcohol treatment. C. Principal components analysis (PCA) of protein expression in response to alcohol treatment and deletion of Ng. Ratio proportion of variance line graph represents the proportion of variance of the first principal components (PC). Ratio scatterplot of genotype and alcohol treatment shows the projection of the first principal component compared to the second principal component. D. Heat map for altered protein expression in response to alcohol treatment and deletion of Ng. Values were normalized by Z-Score. 300 proteins were significantly increased in the NAc of Ng−/− mice by alcohol treatment while 127 proteins were significantly decreased.

