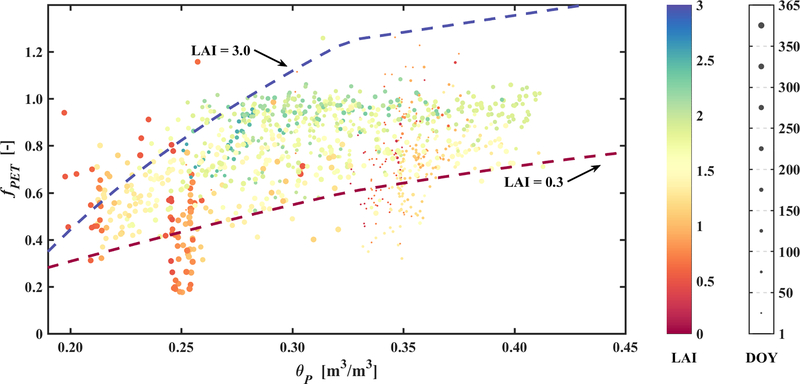
Figure 10.
The relationship between daily mean profile soil moisture (θP) averaged over ground-based vine-row profile soil moisture sensors at 30, 60, 90 cm depths and fPET obtained from flux tower ET measurement and potential ET using the Penman-Monteith equation, shown as scattered points with color representing LAI levels and size representing the Day-Of-Year (DOY). Lines are generated with the model by assuming minimum (0.3) and maximum (3.0) LAI bounds and August 1, 2017 meteorological conditions.

