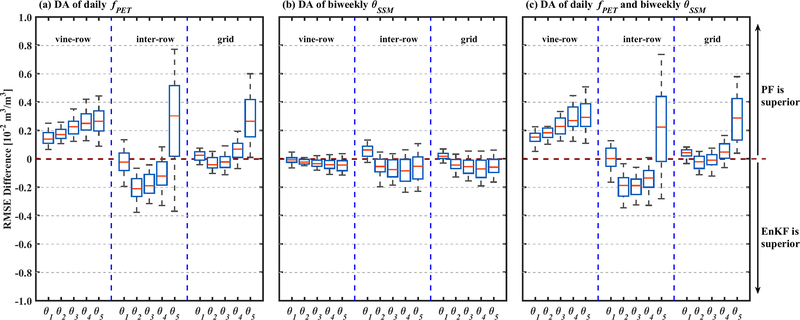
Figure 5.
Box plots of the root-mean-square-error (RMSE) differences (EnKF minus PF) between the EnKF and PF for soil moisture estimates of all five soil layers. Plotted cases are based on the assimilation of: (a) only daily fPET, (b) only biweekly θSSM and (c) both daily fPET and biweekly θSSM. Median values of RMSE differences from 50 separate synthetic experiments are plotted in red. Boxes represent 25–75 quantiles and whiskers represent 5–95 quantiles of replicated experiment results. Positive values indicate superior PF performance.

