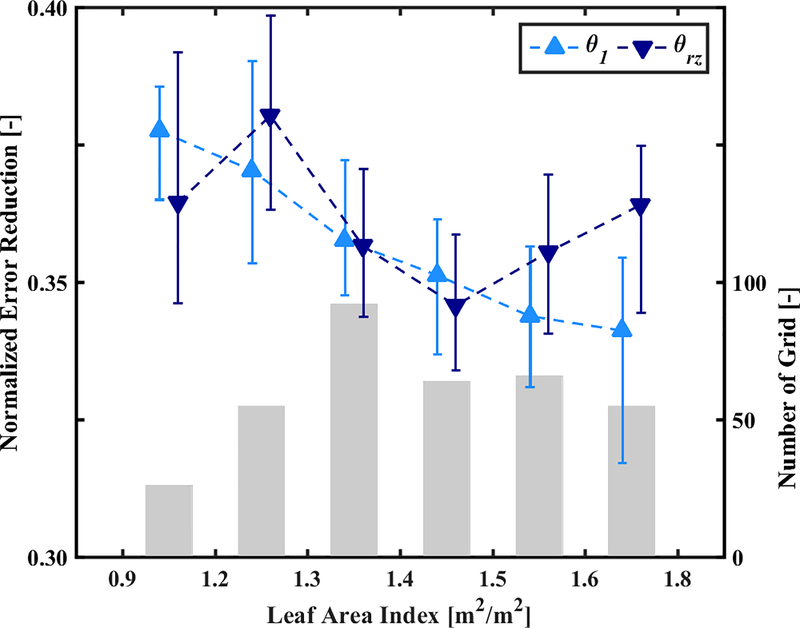
Figure 7.
For the assimilation of daily fPET, spatially averaged NER values of soil moisture states for grids with different LAI levels within the surface-zone (θ1) and root-zone (θrz). Results are shown for the vine-row tile only. Median values are shown as triangles with 10–90 quantiles as vertical bars. The number of 30-m grids with a given time-averaged LAI value are indicated by the grey bars.

