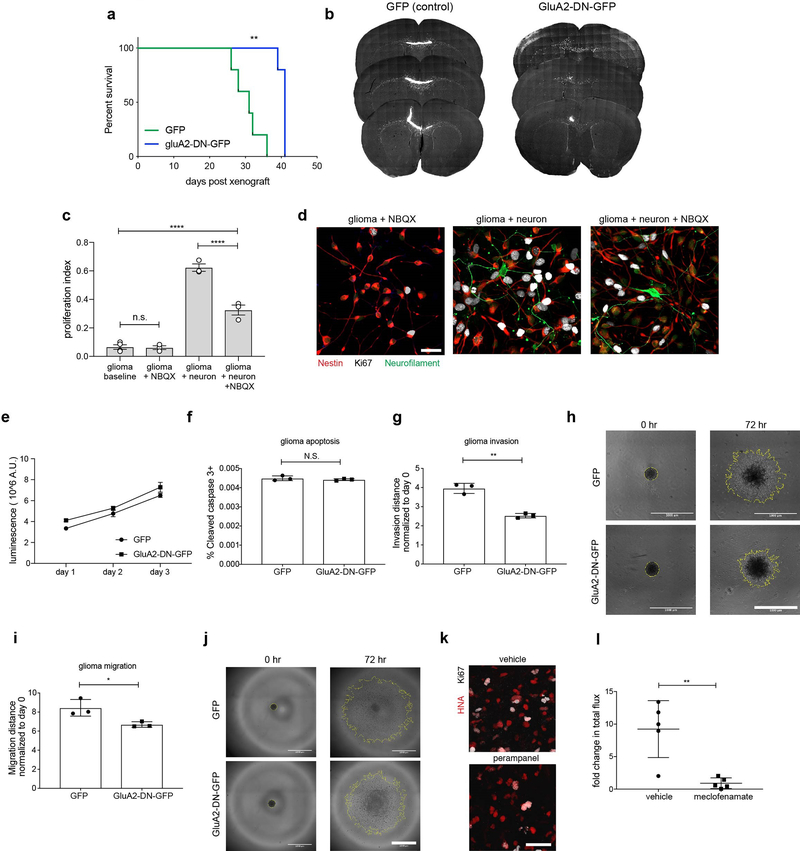
Extended Data Figure 8: Glioma AMPAR function in vitro, in co-culture and in vivo.
a, Kaplan-Meier survival curves of second cohort of mice orthotopically xenografted with control GFP-only or GluA2-DN-GFP over-expressing cells (SU-DIPGXIII-P* xenograft model; n=5 mice per group). b, Representative coronal sections of mouse brains bearing SU-DIPGXIII-FL xenografts either expressing control GFP construct (left) or GluA2-DN-GFP construct; right). Gray, MBP; White, glioma-GFP. c, Proliferation indices of SU-DIPGXIII-FL cells at baseline in neuronal medium, in response to 10μM NBQX, in co-culture with neurons, or in co-culture with neurons in the presence of 10μM NBQX (n=3 biological replicates/group, except n=4 for baseline). d, Representative images of neuron-glioma co-cultures in the presence and absence of NBQX. Green = neurofilament (neuronal processes); Red = nestin (glioma cell processes); White = Ki67. Scale bar = 50μm. e, in vitro growth analysis of control GFP or GluA2-DN-GFP cells monitored over 3 days. f, in vitro apoptosis analysis of control GFP or GluA2-DN-GFP as measured by % of total cells co-stained with cleaved-caspase. g, 3D Matrigel invasion assay in WT (GFP) and GluA2-DN (GluA2-DN-GFP) expressing SU-DIPGXIII-FL cells 72 hours after seeding. h, Representative images of (g) at time 0 hr (left) and 72 hr (right) in control GFP-expressing (top) and GluA2-DN-GFP expressing cells (bottom). Scale bar = 1000μm. i, 3D migration assay in WT (GFP) and GluA2-DN (GluA2-DN-GFP) expressing SU-DIPGXIII-FL cells 72 hours after seeding. j, Representative images of (i) at time 0 hr (left) and 72 hr (right) in control GFP-expressing (top) and GluA2-DN-GFP expressing cells (bottom). Scale bar =1000μm. k, Representative confocal micrographs illustrating proliferating SU-DIPGVI cells in vehicle or perampanel-treated mice (n=8 mice/group). Red = human nuclei; white = Ki67. Scale bar = 50μm. l, IVIS bioluminescence analysis of overall tumor growth in SU-DIPGXIII-FL xenografts treated with vehicle or meclofenamate over a two-week period. Data represented as fold change in total flux; n=5 mice/group. Data shown as mean ± s.e.m. for (c,e,f,g,i,l). For analyses in (d-j), n=3 biological replicates. P-values determined by two-tailed log rank analyses (a), by one-way ANOVA with post-hoc analysis (c), by two-tailed unpaired Student’s t-test (f,g,i,l). *P<0.05, **P< 0.01,****P<0.0001. NS = not significant.

