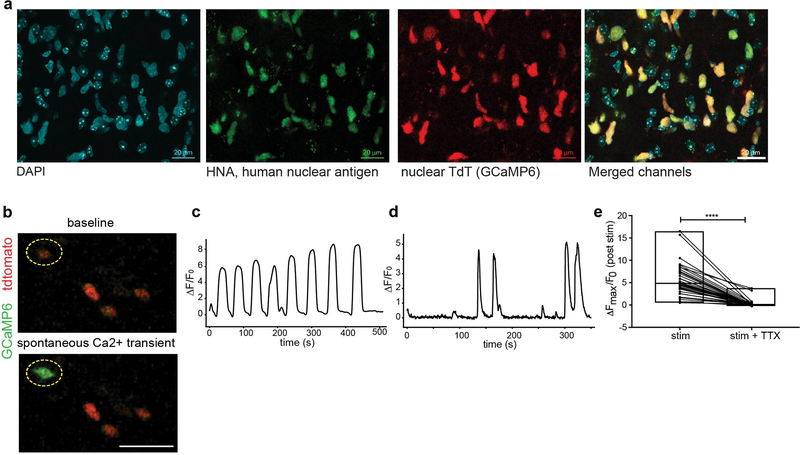
Extended Data Figure 4: Glioma xenograft calcium imaging with GCaMP6.
a, Confocal micrographs of xenografted SU-DIPGXIII-FL cells expressing GCaMP6s-tdTomato into the hippocampus stained with DAPI (blue), human nuclear antigen (HNA, green), and TdTomato nuclear tag (red). Merged image shown on the right illustrates specificity of Tdtomato tag to HNA+ cells. Scale bar = 20μm for all images. Immunostaining independently replicated in three mice. b, Spontaneous calcium transients in SU-DIPGVI xenograft visualized by two-photon in situ calcium imaging. Representative frames shown with red = glioma td-Tomato nuclear tag; green = GCaMP6s in glioma cells. Scale bar = 50μm; n=5 mice. See also Supplementary Video 1. c, Trace of normalized GCaMP6s intensity over time in an individual xenografted glioma (SU-DIPGVI) cell exhibiting an oscillatory spontaneous transient. Data plotted as ρF/Fo. Results were replicated across n=3 mice. d, As in (c), trace of normalized GCaMP6s intensity over time in an individual xenografted glioma (SU-DIPGXIII-FL) cell exhibiting a less regular spontaneous transient. This type of transient is more frequently observed in glioma xenografts. Data plotted as ρF/Fo. Results were replicated across n=3 mice. e, Individual xenografted glioma (SU-DIPGXIII-FL) cellular responses to axonal stimulation before and after application of tetrodotoxin (0.5μM) as measured by GCaMP6s intensity. Data plotted as ρFmax/Fo; n=40/4 cells/mice. P-values determined by one-tailed Wilcoxon matched-pairs signed rank test. **** P < 0.0001.

