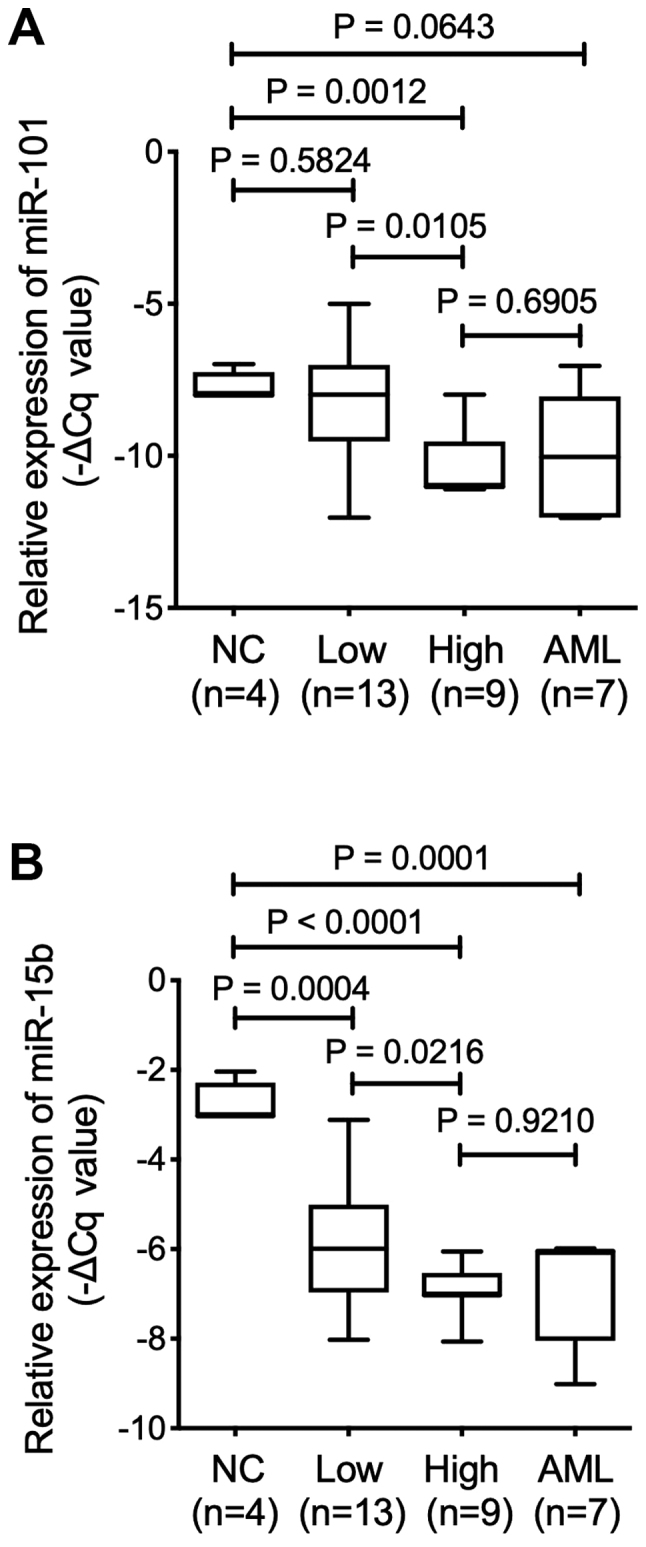
Figure 1.

Expression of extracellular vesicle miR derived from BM-MSCs using TaqMan low-density Array (Thermo Fisher Scientific, Inc.). miR expression according to normal control (NC) vs. low-risk MDS group (Low), high-risk MDS group (High) and AML/MRC group (AML). Box plots depict the 75th percentile, median and 25th percentile values; and whisker plots represent minimum to maximum expression. P values were calculated using the independent two-sample t-test. (A) The expression of EV-miR-101 was significantly higher in the low-risk group compared with the high-risk group. The expression of miR-101 in the low-risk group indicated no significant difference compared with the normal controls. (B) Significant differences in the expression of miR-15b were observed between low-risk and normal control groups. miR, microRNA; BM-MSCs, bone marrow mesenchymal stromal cells; NC, negative control; MDS, myelodysplastic syndrome; AML/MRC, acute myeloid leukemia with myelodysplasia-related changes.
