Figure 6.
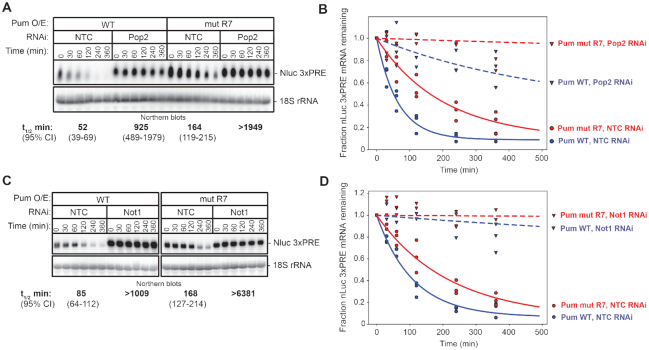
Pum-mediated mRNA decay requires Not1 and Pop2. (A) The effect of RNAi-mediated depletion of Pop2 by Pop2 dsRNA1 on the mRNA decay rate of Nluc 3× PRE reporter mRNA was measured in response to over-expressed wild type Pum (Pum WT) or the RNA-binding defective mutant Pum (Pum mut R7) following inhibition of transcription with ActD. Cells treated with NTC dsRNA served as negative control. The Nluc 3× PRE was detected by Northern blot along with 18S ribosomal RNA (rRNA), as a loading control. Each lane of the gel contains 10 μg of total RNA. The mRNA half-lives and 95% credible intervals measured in each condition are shown below the respective blots, and were calculated from three experimental replicates. Data and statistics are reported in Supplementary Table S1. (B) The fraction of Nluc 3× PRE mRNA remaining, normalized to 18S rRNA, is plotted relative to time (minutes) after inhibition of transcription. Datum points for each of three experimental replicates are plotted. First order exponential decay trend lines, calculated using non-linear regression analysis, are plotted for each effector (Pum WT in blue, and mut R7 in red) in each RNAi condition (NTC, solid lines, and Pop2, dashed lines). (C) The effect of RNAi-mediated depletion of Not1 on the mRNA decay rate of Nluc 3× PRE reporter mRNA was measured in response to over-expressed wild type Pum (Pum WT) or the RNA-binding defective mutant Pum (Pum mut R7) following inhibition of transcription with ActD. Cells treated with NTC dsRNA served as negative control. The Nluc 3× PRE was detected by Northern blot along with 18S ribosomal RNA (rRNA), as a loading control. Each lane of the gel contains 10 μg of total RNA. The mRNA half-lives and 95% credible intervals measured in each condition are shown below the respective blots, and were calculated from three experimental replicates. Data and statistics are reported in Supplementary Table S1. (D) The fraction of Nluc 3× PRE mRNA remaining, normalized to 18S rRNA, is plotted relative to time (minutes) after inhibition of transcription. Datum points for each of 3 experimental replicates are plotted. First order exponential decay trend lines, calculated using non-linear regression analysis, are plotted for each effector (Pum WT in blue and mut R7 in red) in each RNAi condition (NTC, solid lines and Not1, dashed lines).

