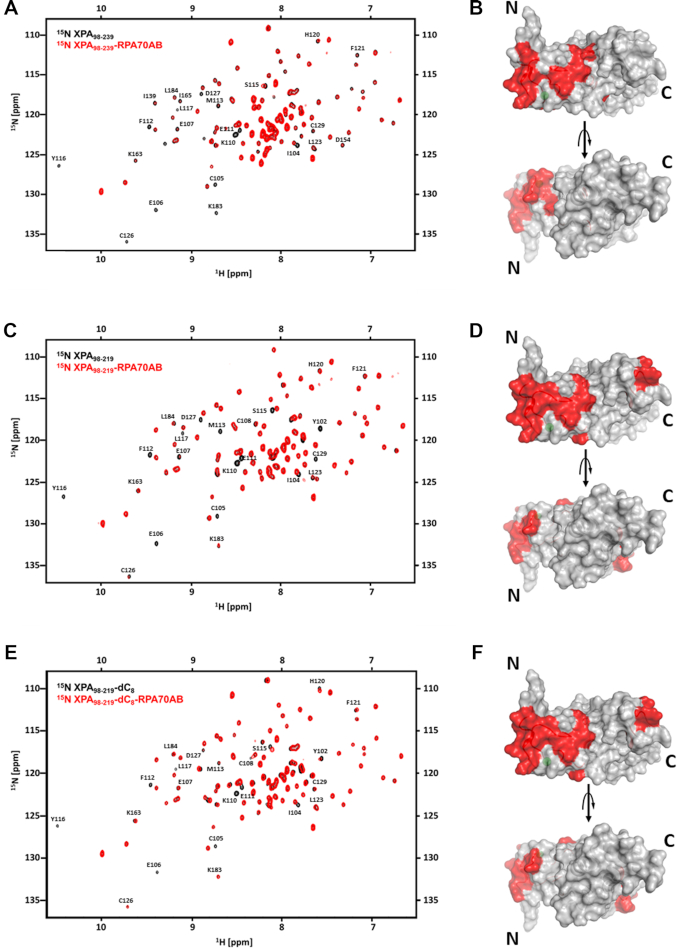
Figure 2.
NMR mapping of the RPA70AB-binding site in XPA DBD. (A and B) NMR titration of 15N-enriched XPA98–239 with RPA70AB. (A) Overlay of the 900 MHz 15N-1H TROSY-HSQC spectrum of 15N-XPA98–239 in the absence (black) and presence (red) of RPA70AB in a 1:4 molar excess. (B) Residues whose signals are perturbed in (A) mapped in red on the structure of the globular core of XPA. (C–F) NMR titrations of 15N-enriched XPA98–219 with RPA70AB in the absence (C,D) or presence (E,F) of ssDNA. (C) Overlay of the 900 MHz 15N-1H TROSY-HSQC spectrum of 15N-XPA98–219 in the absence (black) and presence (red) of RPA70AB in a 1:4 molar excess. (D) Residues whose signals are perturbed in (C) mapped in red on the structure of the globular core of XPA. (E) Overlay of the 900 MHz 15N-1H TROSY-HSQC spectrum of 15N-XPA98–219 pre-equilibrated with dC8 in the absence (black) and presence (red) of RPA70AB in a 1:4 molar excess. (F) Residues whose signals are perturbed in (E) mapped in red on the structure of the globular core of XPA. The threshold for significance of CSPs and line broadening was set to the average of unperturbed resonances ±1 standard deviation. All spectra were acquired in a buffer containing 20 mM Tris, pH 7.0, 150 mM KCl, 1 mM Tris (2-carboxyethyl) phosphine (TCEP) and 5% 2H2O at 25°C.

