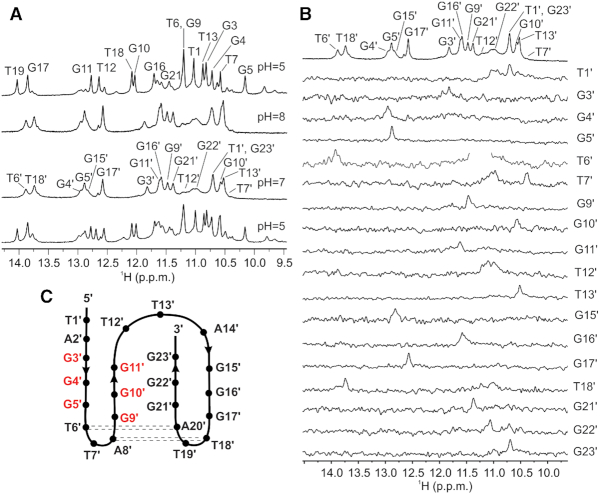
Figure 7.
pH switch. (A) Imino region of 1D 1H NMR spectra at different pH values of htel1 at low cation concentration in 10% 2H2O at 5°C. Spectrum on the top was recorded first and spectrum at the bottom was recorded 5 min after reducing pH back from 7 to 5. (B) Unambiguous assignment of the htel1 imino resonances at pH 7. The imino region of 1D 1H NMR spectrum of unlabelled sample (top) and imino regions of the 1D 1H-15N HSQC spectra acquired on partly (∼ 8%) residue-specific 15N, 13C-labelled oligonucleotides htel1. Spectra were recorded in 10% 2H2O on 800 MHz spectrometer at 5°C in the absence of cations that promote G-quartet formation at DNA concentration of 1.0 mM. (C) Topology of pre-folded structures adopted by htel1 in the absence of cations at pH 7. Dashed lines represent A•T base pairs, respectively. Residues marked with red belong to the first and the second G-tracts that are connected in antiparallel orientation.

