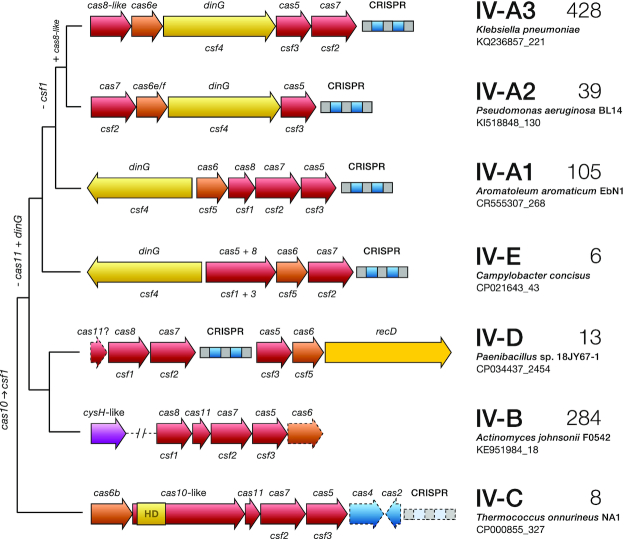
Figure 1.
A proposed classification of type IV CRISPR–Cas systems based on their genome loci architectures and evolutionary relationships. Phylogenetic tree depicting the typical operon organization of the identified subtype IV loci. A selected representative locus is shown for each clade wherein genes are colour-coded and labelled according to the protein families they encode, using both the cas (upper) and csf (lower) nomenclatures. Genes or CRISPR arrays that are not invariably present are represented with dashed lines on the gene maps. The number of loci identified for each clade is given on the right. Hypothesized gene gain/loss events over the course of evolution are shown on the left.

