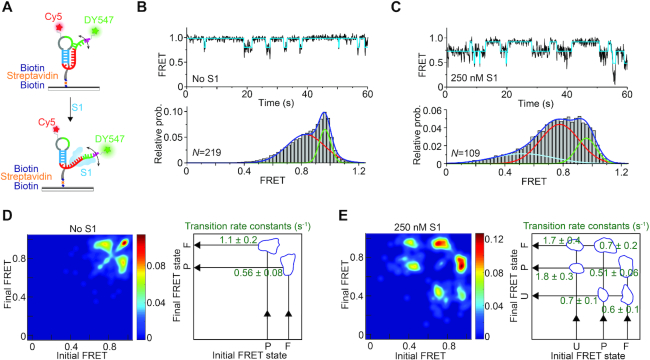
Figure 5.
smFRET analysis reveals S1-mediated unfolding of the Tte pseudoknot. (A) Schematic depiction of our smFRET experimental setup. The doubly labeled Tte pseudoknot was immobilized on a PEG-coated quartz slide via a biotin-streptavidin linkage and imaged by TIRF microscopy. (B) Representative smFRET trace (top) for the pseudoknot alone showing fluctuations between mid-FRET (pre-folded; P) and high-FRET (folded; F) states. The cyan line represents the idealized FRET trace from Hidden Markov modeling (HMM). An smFRET histogram (bottom) constructed from the FRET values observed in the first 100 frames from N single molecule traces reveals the two major FRET states fitted with Gaussian distributions. (C) Representative smFRET trace (top) and corresponding histogram (bottom) as in (B) of the Tte pseudoknot in the presence of 250 nM S1, showing the dynamic nature of the S1-bound unfolded (U) pseudoknot. The addition of S1 introduces a third, low-FRET state in the smFRET histogram, corresponding to RNA pseudoknot conformations that are unfolded to an even greater extent. (D, E) Transition occupancy density plots (TODPs) illustrating the most common FRET transitions (left panels) and corresponding mean rate constants (right panels) in the absence (D) and presence (E) of S1.

