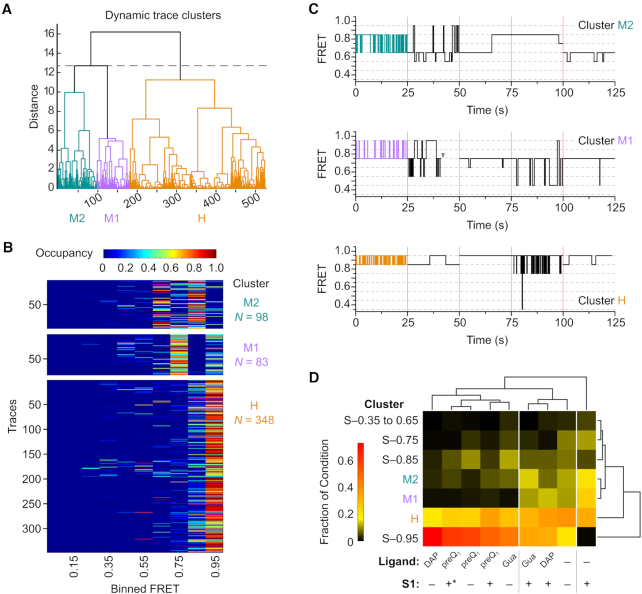
Figure 7.
Single molecule cluster analysis identifies classes of dynamic behavior as a function of RNA stability. (A) Dendrogram of dynamic traces resulting from hierarchical clustering analysis to identify patterns of trace behavior. Of the 1160 total molecules included in the analysis, only the 529 dynamic molecules are shown in the dendrogram. The dashed line indicates the threshold of three clusters used to describe the data. Dynamic clusters were assigned labels loosely based on the predominant FRET ranges observed: M2 (mid-FRET 2, teal), M1 (mid-FRET 1, purple), H (high-FRET, orange). (B) Occupancy heat maps for traces in each of the dynamic clusters shown in (A). Each trace is represented by a single row in the heat map, and is colored according to the fraction of the total observation time spent in each of the 10 binned FRET states (Occupancy). N, number of single molecule traces in the cluster. (C) Representative trace segments from each of the dynamic clusters. For each dynamic cluster, 25 s of idealized FRET trace data are shown for five individual traces, separated by magenta bars. The first trace shown (colored segment) is taken from the trace closest to the cluster centroid, and the remaining four segments are randomly chosen from other traces in the cluster. The gray arrowhead represents the point at which photobleaching of the fluorophores occurred. (D) Clustergram from second-round clustering showing the relationship between patterns of static and dynamic trace behavior identified in first-round clustering (rows) and experimental condition (columns). Each experimental condition is represented by a heat map, colored according to the fraction of traces from that condition that were grouped into each of the static or dynamic first-round clusters. White vertical lines indicate experimental conditions that group together based on similar distributions of the observed patterns of trace behaviors. * indicates the experimental condition where S1 was introduced before the addition of the preQ1 ligand.

