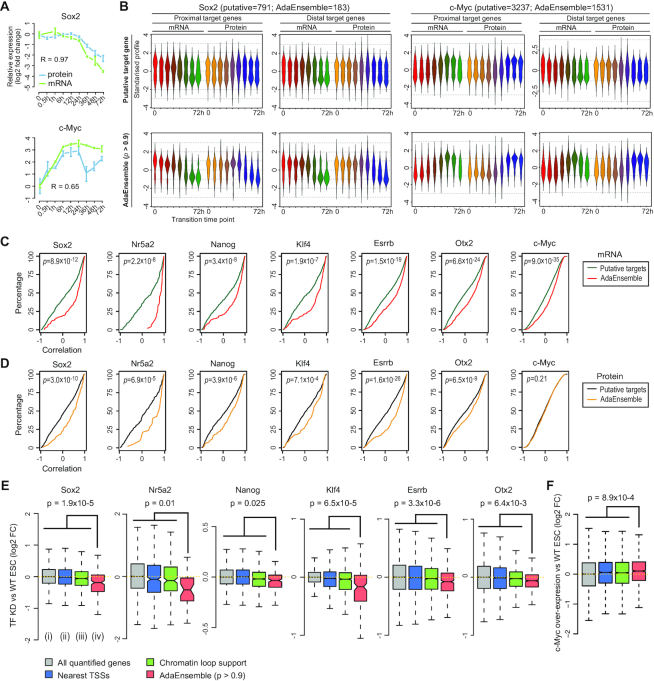
Figure 2.
Prediction and validation of TF target genes in transition from naive to formative pluripotency using AdaEnsemble and trans-omic data. (A) Time-course showing the log2 fold change (compared to time = 0) in expression for mRNA (green) and protein (blue) for Sox2 and c-Myc. Bars represent standard deviation among biological replicates (n = 2 for mRNA and n = 4 for protein). Pearson's correlation coefficient for concordance between protein and mRNA are shown. (B) Time-course expression profiles of putative target genes (i.e. putative candidates) supported by chromatin loops from Pol2-ChIA-PET (top) and AdaEnsemble predicted target genes (bottom) for Sox2 and c-Myc, respectively. Profiles are divided into those from promoter-proximal and distal target genes, and then further divided into those from mRNA and protein levels. (C, D) Cumulative distribution showing degree of correlation (Pearson's) between time-course expression profiles of each TF with its putative target genes (green and black) and those predicted by AdaEnsemble (red and yellow), on mRNA (C, red) and protein (D, yellow) levels. P-values were computed using Wilcoxon Mann-Whitney U test (two-sided). (E) Log2 fold change in mRNA after Sox2, Nr5a2, Nanog, Klf4, Esrrb knockdown, or Otx2 knockout in ESCs compared to WT ESCs. Wilcoxon Mann–Whitney U test (one-sided) are performed on AdaEnsemble-identified target genes (iv) versus all quantified genes (i), proximal and distal target genes by nearest TSS assignment of all TF binding sites identified in ChIP-seq data (ii), and putative target genes by chromatin loop support (Pol2-ChIA-PET) (iii), respectively, and the largest p-value is displayed as an upper bound for all pairwise comparisons for each TF. (F) Similar to (E) but in c-Myc overexpressed ESCs compared to WT ESCs.

