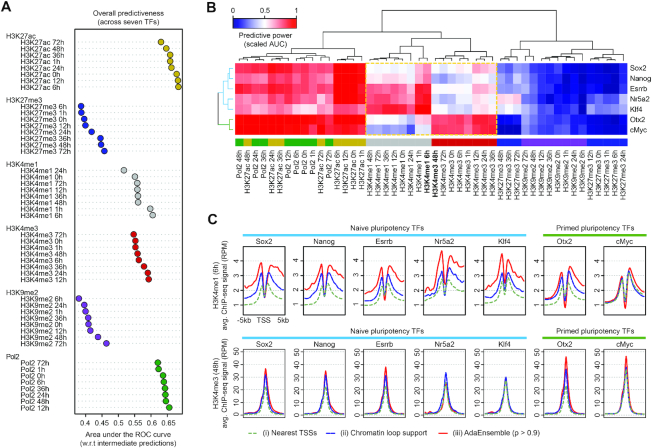
Figure 3.
Evaluation of predictability of histone marks and Pol2 ChIP-seq on TF target genes. (A) Overall predictive power (in terms of area under the ROC curve [AUC]) of histone marks and Pol2 ChIP-seq data, averaged across all seven TFs, when assessed against the intermediate predictions from the initial training phase of AdaEnsemble. (B) Bi-clustered heatmap showing relationship among histone modifications and Pol2 ChIP-seq in terms of predictiveness (scaled AUC) in TF target genes. The dashed box highlights H3K4me1 and H3K4me3 marks for their contrast between naive pluripotency TFs (Sox2, Nanog, Esrrb, Nr5a2, Klf4) and formative pluripotency TFs (Otx2 and c-Myc). (C) Levels of H3K4me1 (6 h) and H3K4me3 (48 h) signal at the promoters of the target genes of naive and primed pluripotency TFs.

