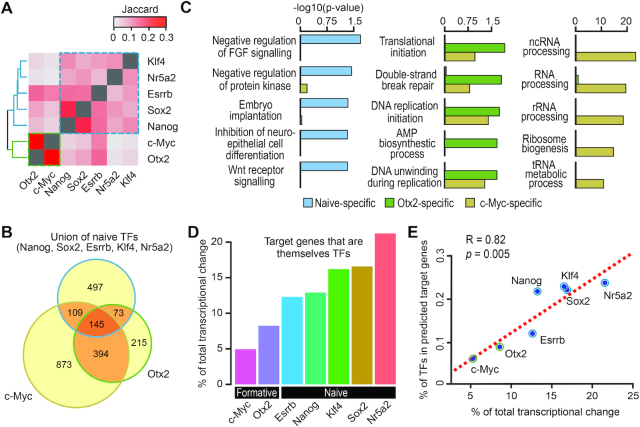
Figure 4.
Characterisation of TF target genes and transcriptional networks in naive and formative pluripotency. (A) Heatmap showing proportion (as quantified by Jaccard index) of genes regulated by pairs of TFs. (B) Venn diagram showing a three-way overlap of target genes of naive TFs (union), Otx2 and c-Myc. (C) Over-representation of gene ontology (GO) of target genes unique to naive TFs (naive-specific), Otx2 (Otx2-specific) and c-Myc (c-Myc-specific). (D) Contribution of target genes that are themselves TFs toward the total transcriptional regulation. (E) Correlation between (D) and the percentage of target genes that are themselves TFs (y-axis) for each of the seven TFs.

