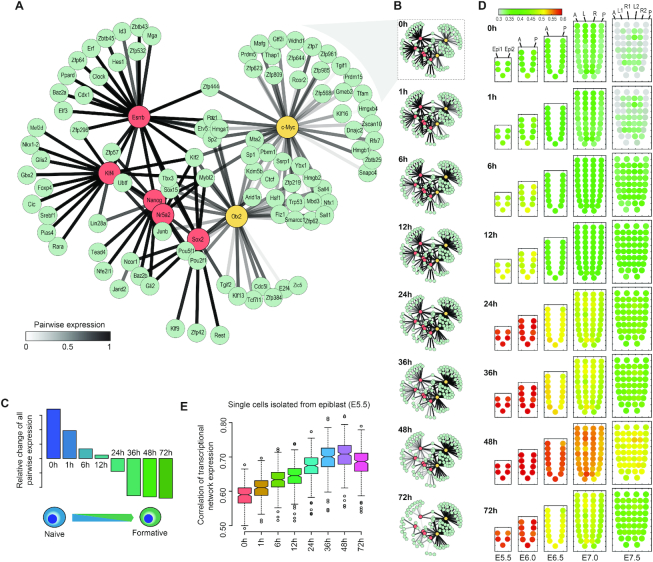
Figure 6.
Dynamic rewiring of transcriptional networks from naive to formative pluripotency. (A) TF networks prior to differentiation (naive pluripotent state). AdaEnsemble-identified TF target genes (prediction probability > 0.95) that are themselves TFs are included in the network reconstruction. Edges measure mean expression of each TF–gene pair. (B) Dynamic change of TF networks during the transition from naive to formative pluripotent states. Edge colour across times reflects the change of expression of each TF–gene pair in the transcriptional networks. (C) Relative change in all pairwise expressions from naive to formative states (see ‘Materials and Methods’ section for details). (D) Mapping the differentiating ESCs to the equivalent epiblast cell populations by the activity of reconstructed transcriptional networks at different time points. Colour of the corn plots denotes enrichment from low (green) to high (red). (E) Correlation between the expression of transcription networks from single cells of the E5.5 epiblast and the ESC to EpiLC transcriptional networks at different time points.

