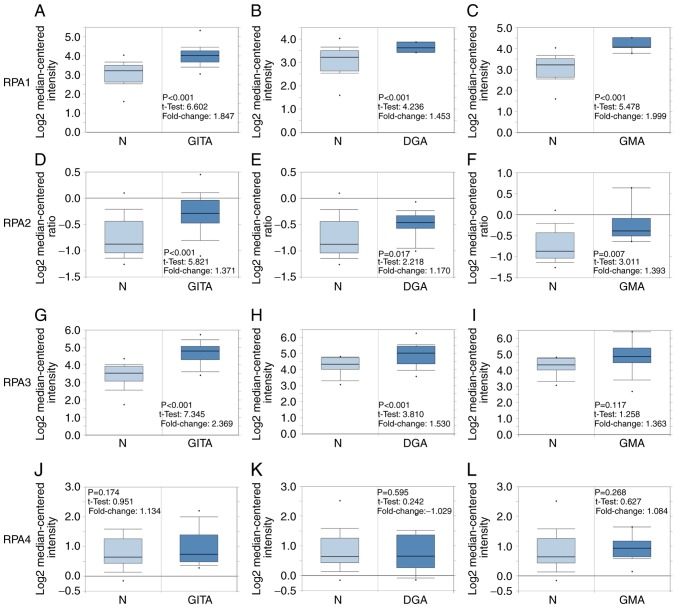
Figure 1.
RPA family analysis in patients with GC. Box plots comparing the expression of specific RPA family members in normal and GC tissues, based on datasets retrieved from the Oncomine database. (A-C) Comparison of RPA1 mRNA expression levels between normal tissues and those in (A) GITA, (B) DGA and (C) GMA. Comparison of RPA2 mRNA expression between normal and (D) GITA, (E) DGA and (F) GMA tissues. (G-I) Comparison of RPA3 mRNA expression between normal and (G) GITA, (H) DGA and (I) GMA tissues. Comparison of RPA4 mRNA expression between normal and (J) GITA, (K) DGA and (L) GMA tissues. GC, gastric cancer; GITA, gastric intestinal type adenocarcinoma; DGA, diffuse gastric adenocarcinoma; GMA, gastric mixed adenocarcinoma; RPA, replication protein A.

