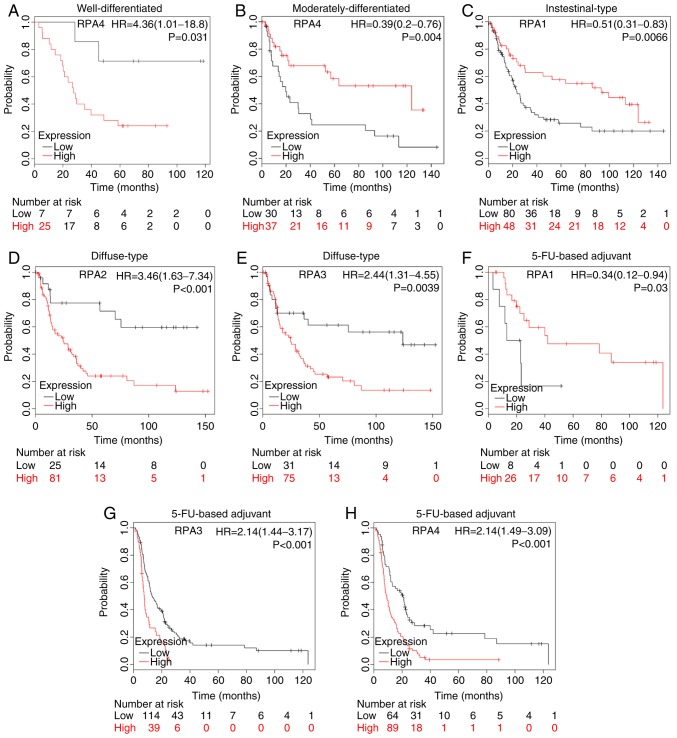
Figure 5.
Prognostic value of RPA family expression levels in various clinicopathological subsets of patients with GC. Survival curves of RPA4 (Affymetrix ID: 221143_at) are plotted for (A) well-differentiated tumors, high-(n=25) vs. low-expression group (n=7); and (B) moderately-differentiated tumors, high-(n=37) vs. low-expression group (n=30). KM survival curve showing (C) RPA1 (Affymetrix ID: 236675_at) expression in patients with intestinal-type GC; high-(n=48) vs. low-expression group (n=80). KM plot of patients with diffuse type GC analyzing (D) RPA2 (Affymetrix ID: 201756_at); high-(n=81) vs. low-expression group (n=25). (E) RPA3 (Affymetrix ID: 209507_at), high-(n=75) vs. low-expression group (n=31). KM survival curves comparing high and low RPA family expression in patients receiving 5-FU-based adjuvant therapy. (F) RPA1 (Affymetrix ID: 236675_at); high-(n=26) vs. low-expression group (n=8). (G) RPA3 (Affymetrix ID: 209507_at); high-(n=39) vs. low-expression group (n=114). (H) RPA4 (Affymetrix ID: 221143_at); high-(n=89) vs. low-expression group (n=64). GC, gastric cancer; RPA, replication protein A; HR, hazard ratio; KM, Kaplan-Meier; FU, fluorouracil.

