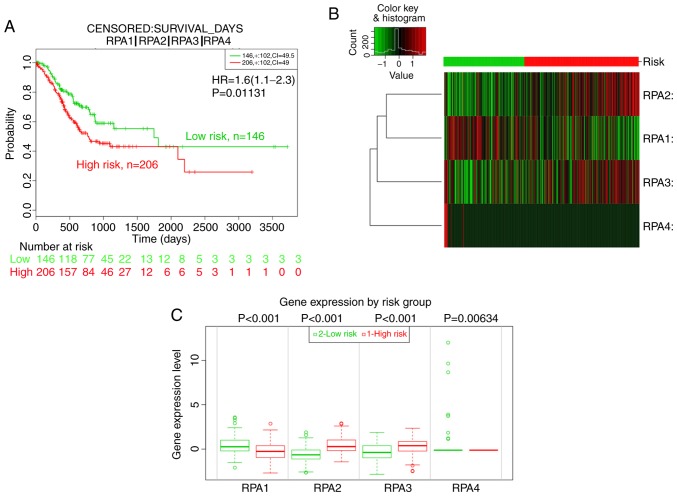
Figure 6.
Prognostic analysis of the RPA family signature using the SurvExpress platform. (A) KM analysis of the OS between high-(n=206, red) and low-risk (n=146, green) groups using data from TCGA. (B) Heat map showing RPA expression levels (red: High risk; green: Low risk). (C) mRNA expression level of RPA family member proteins between high- and low-risk groups. GC, gastric cancer; RPA, replication protein A; KM, Kaplan-Meier; TCGA, The Cancer Genome Atlas; OS, overall survival.

