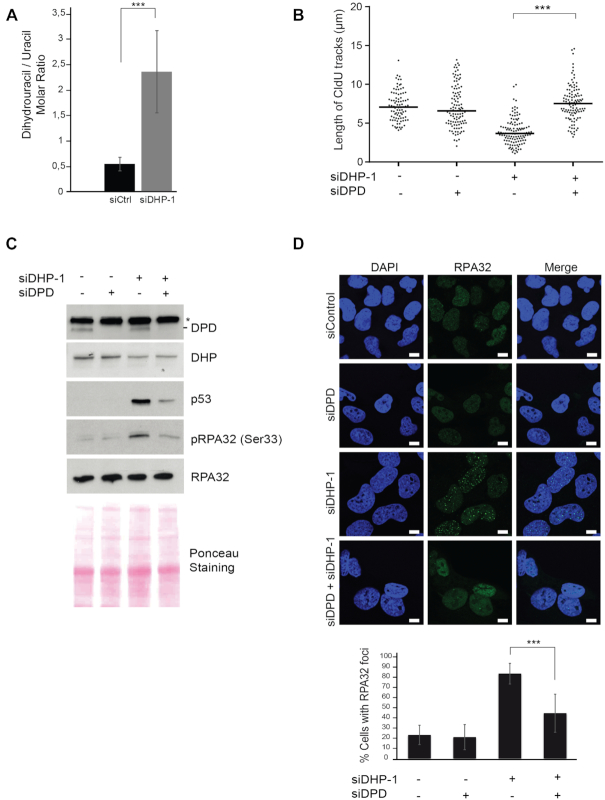
Figure 3.
Accumulation of dihydropyrimidines induces DNA replication stress. (A) The concentrations of dihydrouracil and uracil were measured in U-2 OS cells transfected with control or anti-DHP siRNA (siDHP-1). The ratio of molar concentrations between the two metabolites in each sample is presented. Data from three independent biological replicates, with three technical replicates for each, are represented as mean ± S.E.M. P-values were calculated using a regression model with Poisson distribution: ***P < 0.0001. (B) Replication tracks were labeled with two consecutive pulses of 30 min with CldU and IdU in U-2 OS cells transfected with the indicated siRNAs. Graphic representations of replication track lengths measured in μm (y-axis). The bar dissecting the data points represents the median of 100 tracts length from one biological replicate. Differences between distributions were assessed with the Mann–Whitney rank sum test. P-values: *** < 0.0001. (C) Western blot analysis with the indicated antibodies of whole cell extracts from U-2 OS transfected with anti-DHP and anti-DPD siRNAs, as indicated, Ponceau staining was used as control of protein loading and transfer. * non-specific band. One representative experiment is shown from two biological replicates. (D) RPA32 immunofluorescence staining of U-2 OS cells transfected with the indicated siRNAs. Bars indicate 10 μm. DNA was stained by Hoechst. Bottom panel: Histogram representation of the percentage of RPA32 foci-positive cells in a population of 100 cells. Data from three independent biological replicates are represented as mean ± S.D. P-values were calculated using a regression model with Poisson distribution: ***P < 0.0001.

