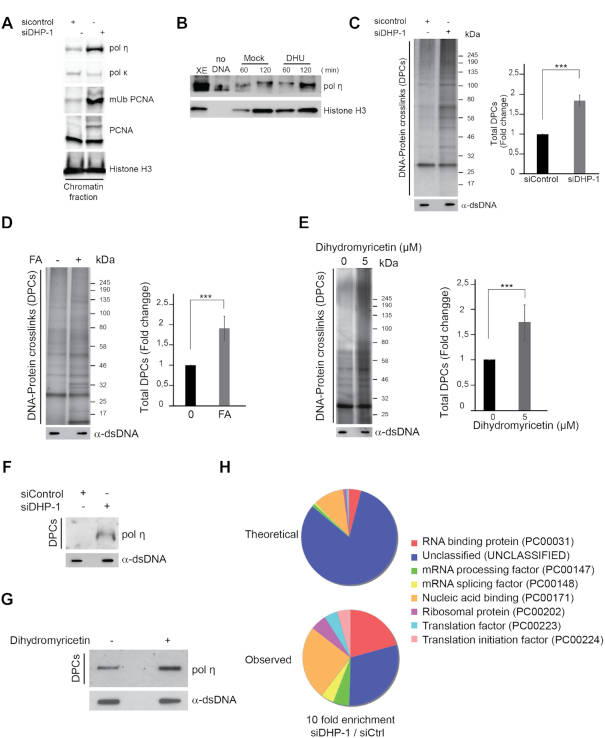
Figure 6.
Dihydropyrimidines metabolites induce DPCs. (A) The chromatin fraction of control and DHP knockdown U-2 OS cells (siDHP-1) was subjected to western blot analysis with the indicated antibodies. Histone H3 was used as loading control. One representative experiment is shown from two biological replicates. (B) Chromatin extracts from nuclei incubated in control and DHU (7.5 mM) containing extracts for 60 and 120 min were subjected to western blot analysis with the indicated antibodies. Histone H3 was used as loading control. One representative experiment is shown from two biological replicates. (C) Total DPC levels in U-2 OS cells transfected with control or anti-DHP siRNA (siDHP-1) visualized by silver staining. Right panel: Histogram representing the quantification of DPC levels normalized to total DNA amount by image J. Three independent biological replicates are averaged in the bar graphs. Error bars represent ± S.D. P-values were calculated using a regression model with Poisson distribution: ***P < 0.0001. (D) Total DPC levels in U-2 OS cells treated or not with 1 mM FA for 2 h visualized by silver staining. Right panel: Histogram representing the quantification of DPC levels normalized to total DNA amount by image J. Three independent biological replicates are averaged in the bar graphs. Error bars represent ± S.D. P-values were calculated using a regression model with Poisson distribution: ***P < 0.0001. (E) Total DPC levels after U-2 OS cells treatment with DMSO or 5 μM of Dihydromyricetin for 16 h visualized by silver staining. Right panel: Histogram representing the quantification of DPC levels normalized to total DNA amount by image J. Three independent biological replicates are averaged in the bar graphs. Error bars represent ± S.D. P-values were calculated using a regression model with Poisson distribution: ***P < 0.0001. (F) Western blot analysis of crosslinked DNA polymerase η in total DPC extracts from U-2 OS cells transfected with control or anti-DHP siRNA (siDHP-1) and the corresponding DNA quantification. One representative experiment is shown from two biological replicates. (G) Slot-blot showing crosslinked DNA polymerase η in total DPC extracts from U-2 OS cells treated with 20 μM dihydromyricetin for 16 h and the corresponding DNA quantification. (H) Pie chart representation of gene ontology analyses using the panther Classification system (http://www.pantherdb.org/on). Theoretical relates to gene ontology classification expected from random sampling of the proteome. Observed is the classification of proteins enriched at least 10-folds in DHP-depleted cells versus control cells. Proteins selected for the analysis were identified in three independent experiments.

