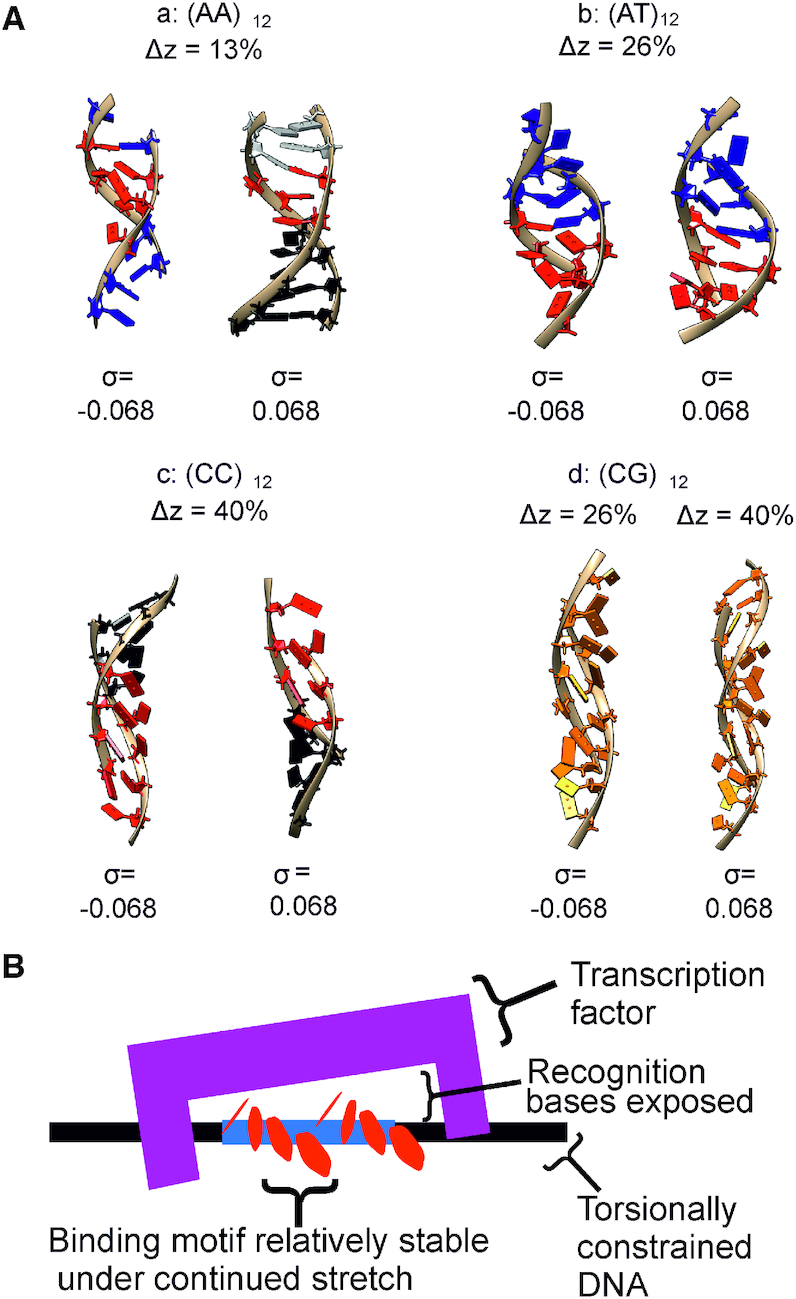
Figure 9.

(A) Structural motifs seen in the four DNA sequences with σ = ±0.068 extracted from different over-stretching extensions from the 200 mM salt simulations. Blue indicates stabilization via non-canonical stacking while red indicates stabilization via non-canonical hydrogen bonding; the distinct interfaces between the two regions are therefore visible. For (CC)12 black is used because the structure is essentially intact. Colouring is taken from the appropriate Figures in the main text and Supplementary Information. (B) A cartoon schematic showing a possible interaction based on the motifs seen in the (AT)12 and (CG)12 simulations. Upon torsionally constrained overstretching, motifs appear which may then be recognized by transcription factors. Durability of the motifs upon additional over-stretching adds reliability to the interaction.
