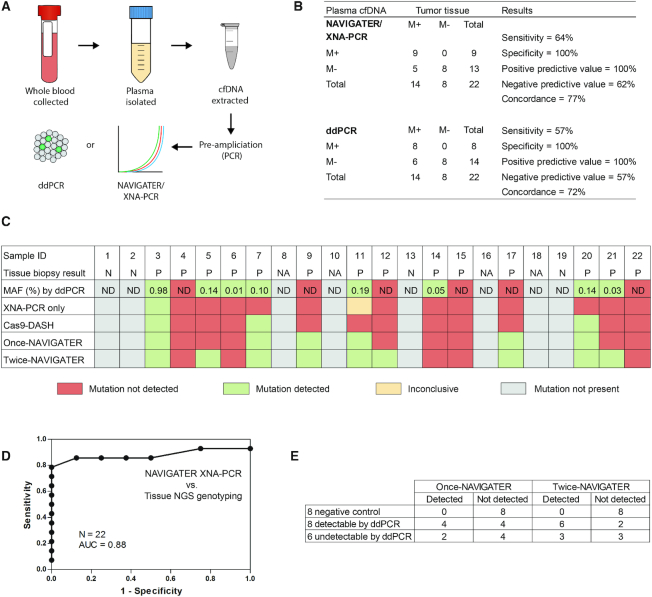
Figure 6.
Detection of low-frequency (<0.2%) KRAS G12 mutations in cfDNA samples from healthy donors [4] and pancreatic cancer patients [18] that are testing positive [14] and negative [4] to KRAS G12 mutations in tissue biopsy. (A) Schematic of patient sample workflow. cfDNA corresponding to equivalent volumes of plasma were assayed by RainDance ddPCR after pre-amplification (9 cycles) and by XNA-PCR without enrichment, cas9-DASH XNA-PCR, and NAVIGATER XNA-PCR after pre-amplification (35 cycles). (B) Performance of twice-NAVIGATER XNA-PCR and ddPCR compared to tissue NGS genotyping (‘gold standard’). M+ = mutation positive. M– = mutation negative. (C) Summary of test results. Gray boxes indicate that mutation was not detected either in tissue or in blood (negative control); red boxes indicate that mutation was detected in tissue but not by the listed method; green boxes indicate that mutation was detected both in tissue and the listed method; and yellow boxes indicate that mutation was detected in tissue and one of the duplicate test by the listed method. ‘XNA-PCR only’ are the results of XNA-PCR of non-enriched patient samples, ‘cas9-DASH’, ‘once-NAVIGATER’, and ‘twice-NAVIGATER’ are, respectively, the results of XNA-PCR of the enriched products of cas9-DASH, one round of NAVIGATER, and two rounds of NAVIGATER. N = negative. P = positive. ND = not detected. NA = not available because healthy donors didn’t get tissue NGS testing. (D) Receiver operator characteristic (ROC) curve of twice-NAVIGATER XNA-PCR versus tissue NGS genotyping. (E) Summary of results of NAVIGATER XNA-PCR compared with RainDance ddPCR.

