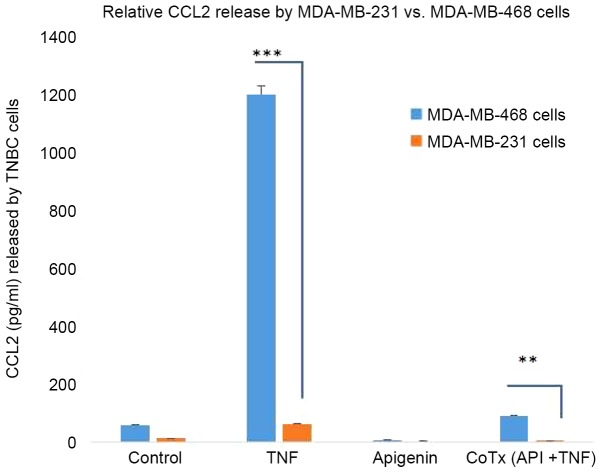
Figure 4.
CCL2 released by untreated controls, TNFα (40 ng/ml), apigenin (40 µM) and CoTx [TNFα (40 ng/ml) + apigenin (40 µM)] after 24 h treatment in MDA-MB-231 and MDA-MB-468 cells at equal plating density. The data are expressed as CCL2 (pg/ml), and statistical differences between the same treatments on different cell lines were determined by one-way ANOVA followed by a Tukey's multiple comparisons test. A significant difference was found in the TNF treatment group and the CoTx (API+TNF) treatment group. **P<0.01; ***P<0.0001. TNF, tumor necrosis factor; CCL2, C-C motif chemokine ligand 2; API, apigenin; CoTx, co-treatment.

