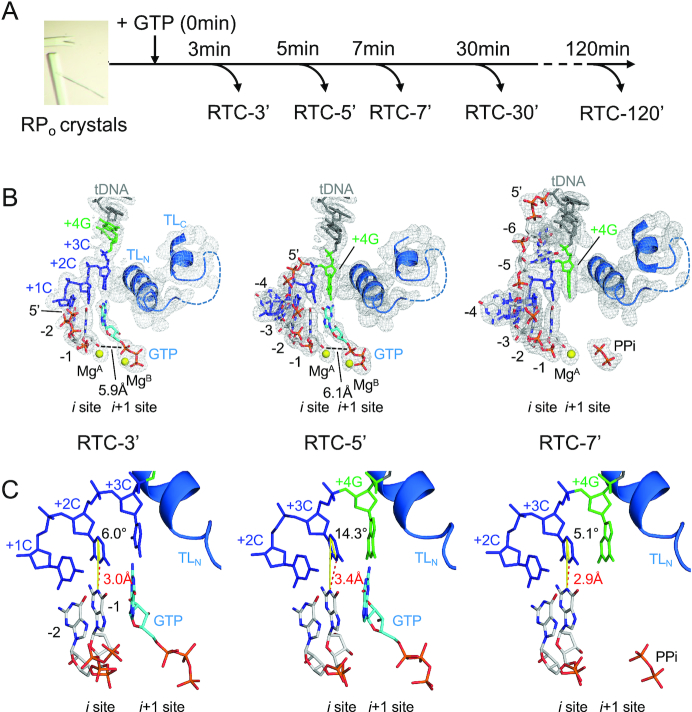
Figure 1.
The structures of RTC from the pyrG promoter. (A) Experimental scheme of the RTC preparation by time-dependent soak–trigger–freeze X-ray crystallography. (B) Structures of the RTC-3′ (left), RTC-5′ (middle) and RTC-7′ (right). RNA, tDNA and incoming GTP are shown as stick models, the Mg ions bound at the active site of RNAP are shown as yellow spheres and the RNAP trigger loop is depicted as a ribbon model. The 2Fo–Fc electron densities for RNA, tDNA and trigger loop are shown (gray mesh, 1.5σ). (C) Analysis of the DNA and RNA base parings at the i site of RNAP active site (RTC-3′, left; RTC-5′, middle; RTC-7′, right). The distances between N1 (RNA G base) and N3 (tDNA C base) are shown as red dashed lines. The angles of the DNA and RNA base pairing [from N1(RNA G base) to C5(tDNA C base) to N3(tDNA C base)] are shown as yellow lines.

