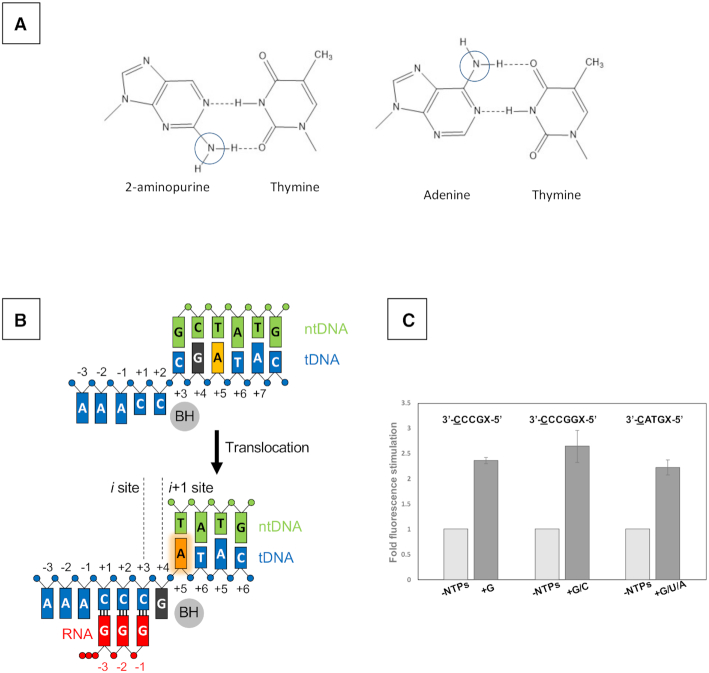
Figure 2.
Monitoring equilibrium DNA translocation state in solution using 2-AP. (A) The fluorophore 2-AP mimics the structure of natural adenine base and participates in the Watson–Crick interaction with thymine. Chemical difference between 2-AP and adenine bases are indicated by cycles. (B) Reaction scheme of reiterative transcription at the pyrG promoter. (C) Fluorescence signal from 2-AP substituted at +5 or +6 position of the template strand DNA. Sequences of tDNA used for each experiment are shown (transcript initiation site, underlined; 2-AP position, X). The similar fork DNA scaffold used for crystallization, including transcription bubble and pyrG promoter initially transcribing region, was used as tDNA.E. coli RNAP holoenzyme was used for the assay. Data are shown as mean ± standard error of the mean.

