
Figure 5.
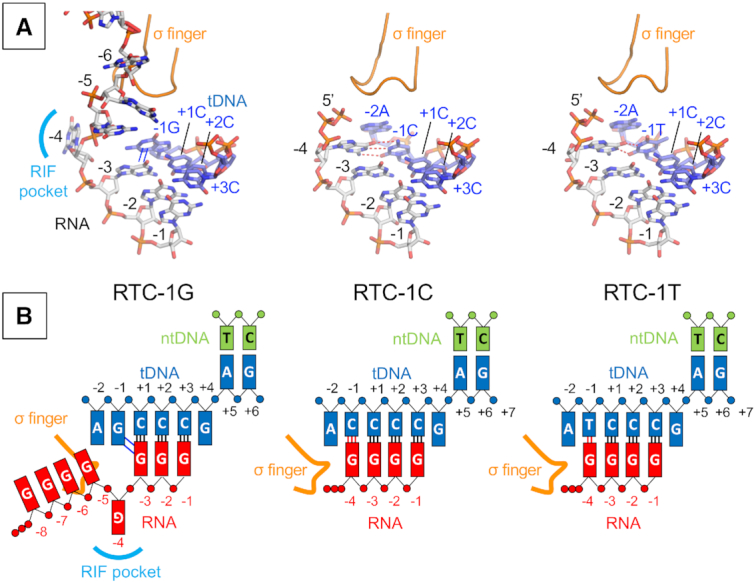
The structures of RTC from the pyrG promoter variants. (A) Structures of the RTC-1G (left), RTC-1C (middle) and RTC-1T (right). RNA and tDNA are shown as stick models and the σ finger is depicted as a ribbon model. Base stacking and base paring interactions are depicted as blue lines (in RTC-1G) and red dashed lines (in RTC-1C and RTC-1T), respectively. (B) Schematic representations of reiterative transcription from the pyrG promoter variants containing −1G (RTC-1G, left), −1C (RTC-1C, middle) and −1T (RTC-1T, right).