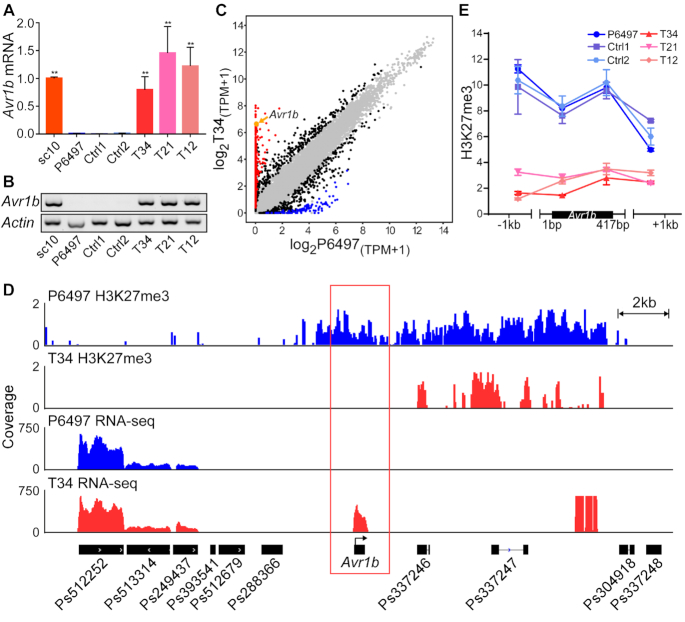
Figure 3.
Editing the PsSu(z)12 locus abolished Avr1b gene silencing and changed the virulence phenotype. (A) Avr1b transcript levels in mycelia of pssu(z)12 mutants measured by RT-qPCR. Transcript levels were normalized with Actin as the internal standard and presented as means ± SEM of three biological replicates. Asterisks represent significant differences (P < 0.01, compared with P6497, Student's t test). sc10 served as the positive (expressed) control, Ctrl1 and Ctrl2 are negative (silenced) controls described in Figure 2C. (B) RT-PCR experiment as (A). Three biological replicates were conducted with similar results. (C) Comparative transcriptome analysis of wild-type P6497 and pssu(z)12Δ mycelia. The x-axis (wild-type P6497) and y-axis (pssu(z)12Δ T34) show log2(TPM+1) of each gene (shown as a dot) based on the mean value of biological replicates, with three replicates of P6497 and two replicates of T34. Black dots represent genes with transcript level differences of >2×-fold change identified by DESeq2 (|log2FoldChange(T34/P6497)| > 1, adjusted P value < 0.01), red dots represent genes with more than ten-fold elevation in T34 compared to P6497 with an adjusted P value < 0.01, while blue dots represent genes with more than ten-fold reduction with adjusted P value < 0.01. Grey dots represent genes lacking differential transcript levels. Avr1b is shown in orange and indicated by an orange arrow. (D) H3K27me3 ChIP-seq and RNA-seq data in the Avr1b region from P6497 and pssu(z)12. Samples were harvested from mycelia, symbols as in Figure 1D with P6497 data in blue and pssu(z)12 data in red. Two and three biological replicates of ChIP-seq were performed for P6497 and T34, two biological replicates were performed for pssu(z)12 mutant T34 RNA-seq, IGV visualization shows similar results from different replicates. (E) H3K27me3 deposition in P6497, pssu(z)12 and controls measured by ChIP-qPCR. Values represent the mean fold changes (±SEM) of the transformants relative to tubulin, which was set as 1. Experiments were repeated twice with similar results.

