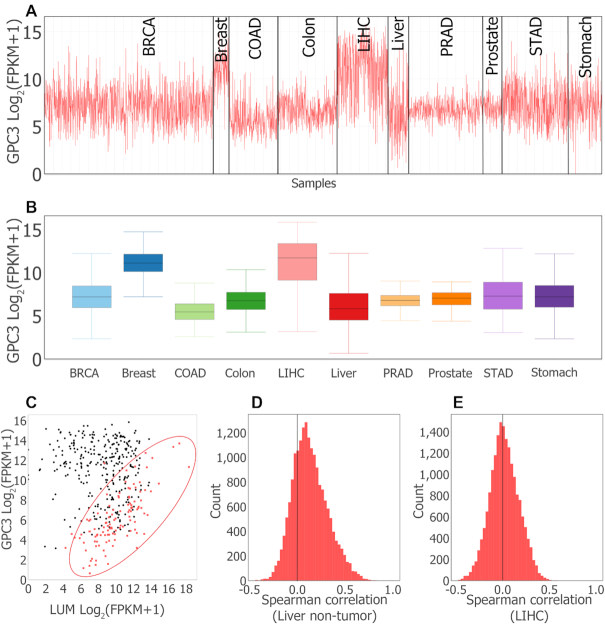
Figure 3.
MOG visualizations of glypican 3 (GPC3) expression pattern in tumor and non-tumor organs. (A) Line chart generated by interactively filtering by study metadata to retain 3184 samples from 5 tumor types and corresponding non-tumor organs, and grouping the chart by organ/tumor type. (B) Box plot summary of data in (A). Generated by interactively splitting box plot according to organ/tumor type. (C) Scatter plot showing co-expression of GPC3 and Lumican (LUM) in liver non-tumor and LIHC samples. In non-tumor liver (red), GPC3 and LUM expression are strongly correlated (Spearman correlation ≤ 0.7). In LIHC samples (black), GPC3 and LUM expression show no association (Spearman correlation = −0.1). (D and E) Histograms of distribution of Spearman correlation coefficients of expression of GPC3 with all other genes. Non-tumor liver samples (D), LIHC samples (E). The longer right tail of non-tumor liver samples indicates Spearman correlation coefficients of GPC3 expression with selected genes are higher in non-tumor than LIHC samples.

