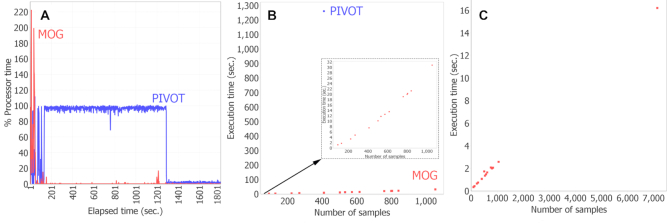
Figure 8.
MOG performance benchmarks. MOG was benchmarked using the entire Hu-cancer-RNASeq-dataset (18 212 genes over 7142 samples), and using chunks of this dataset.(A) Comparison of MOG to R-based (PIVOT). Dataset size was limited to the amount of data that could be loaded in PIVOT (410 samples). % processor time (% CPU utilization) was calculated over 30 min; theoretical maximum value = total processors in computer x 100 (400 in this case). (B) Execution times for computing differentially expressed genes using Mann–Whitney U test. Red dots, MOG; blue dot, PIVOT (410 samples). Inset, expanded scale to display MOG execution times. (C) MOG execution times for pairwise computations of Pearson correlation of a gene (BIRC5) with all other genes in the datasets. (Other tools cannot perform this computation). Execution times are linear with data size; full dataset analysis took 16 s.

