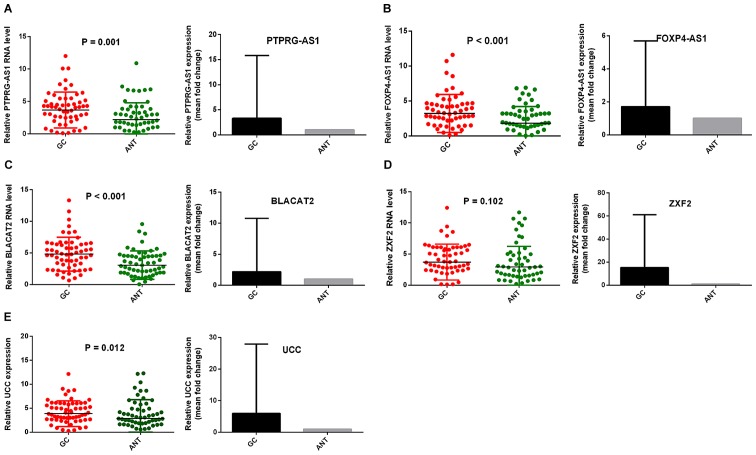
Figure 1.
PTPRG-AS1, FOXP4-AS1, BLACAT2, ZXF2 and UCC were upregulated in GC tissues. Reverse transcription-quantitative PCR results demonstrated that the levels of (A) PTPRG-AS1, (B) FOXP4-AS1, (C) BLACAT2, (D) ZXF2, and (E) UCC in 61 pairs of GC tissues were higher than those in ANTs. Error bars represent the mean ± SD. GC, gastric cancer, ANT, adjacent normal tissues; PTPRG-AS1, PTPRG antisense RNA 1; FOXP4-AS1, forkhead box P4 antisense RNA 1; BLACAT2, bladder cancer-associated transcript 2; UCC, upregulated in colorectal cancer.

