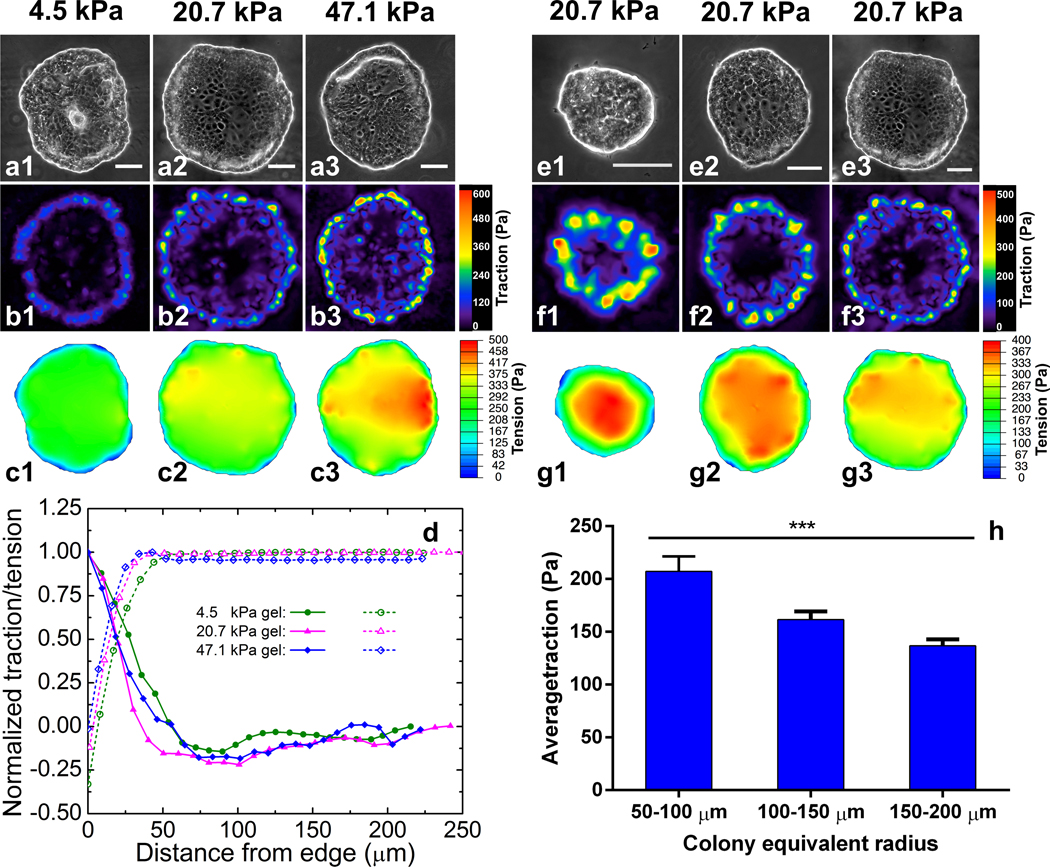
Fig. 2.
Dependence of traction force and intercellular tension at day 2 of culture on both gel stiffness and colony size. (a and e) Phase contrast images of cell colonies on different gel stiffness (a, with gel stiffness of 4.5 kPa, 20.7 kPa and 47.1 kPa, respectively) and with different sizes (e, on 20.7 kPa gels). Scale bar: 100 μm. (b and f) Traction force distributions of the cell colonies. For all the cases, the high traction forces are localized at the boundary layers of the cell colonies and coincide with the regions with high convex curvature. The stiffer the gels, the higher the average traction force (b); the small the cell colonies, the higher average traction force (f). (c and g) Intercellular tension (i.e., hydrostatic stress) distributions of the cell colonies. Intercellular tension ramps up from the boundary layer and reaches nearly uniform tension at the interior of the cell colonies. The uniform tension is proportional to the traction force at the boundary layer. (d) Spatial distribution of traction force (solid line) and intercellular tension (dash line), normalized by their maxima, respectively. (h) The average traction force at the boundary layer (the summation of traction force in the region within 50 μm from colony boundary divided by the area of the region). The average traction force is colony size dependent. ***p<0.001 (one-way ANOVA). Error bars denote standard error of the mean (n≥10).

