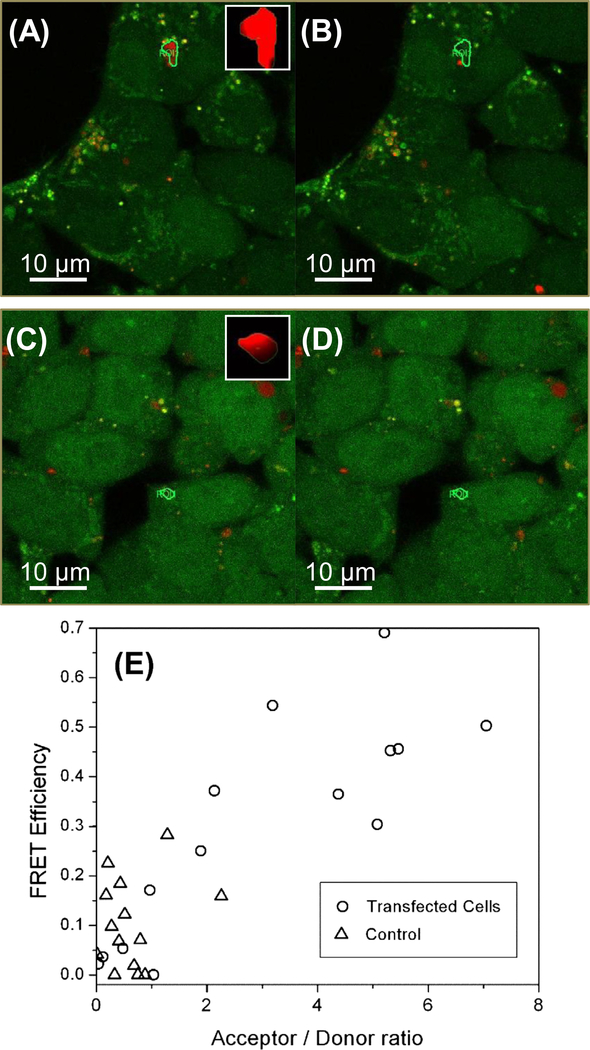
Figure 5.
Live cell FRET study of the in vivo interaction between the C-terminal TC-tagged Vif and Alexa fluor 594 tagged A3G 211–225. (A) Donor and acceptor fluorescent confocal micrographs of transfected cells excited with a 509 nm laser excitation before the acceptor bleaching scan are overlaid in an [r, g, b] format. Inset in (A) shows the emission intensity measured during the bleaching scan, indicating the bleached ROI has a significant acceptor concentration. (B) The same overlaid images after the acceptor-bleaching scan. (C) Donor and acceptor fluorescent confocal micrographs of non-transfected cells excited with a 509 nm laser excitation before the acceptor bleaching scan are overlaid in an [r, g, b] format. Inset in (C) shows the emission intensity measured during the bleaching scan, indicating the bleached ROI has a significant acceptor concentration. (D) The same overlaid images after the acceptor-bleaching scan. (E) FRET efficiency versus acceptor/donor ratio intensity ratio.

