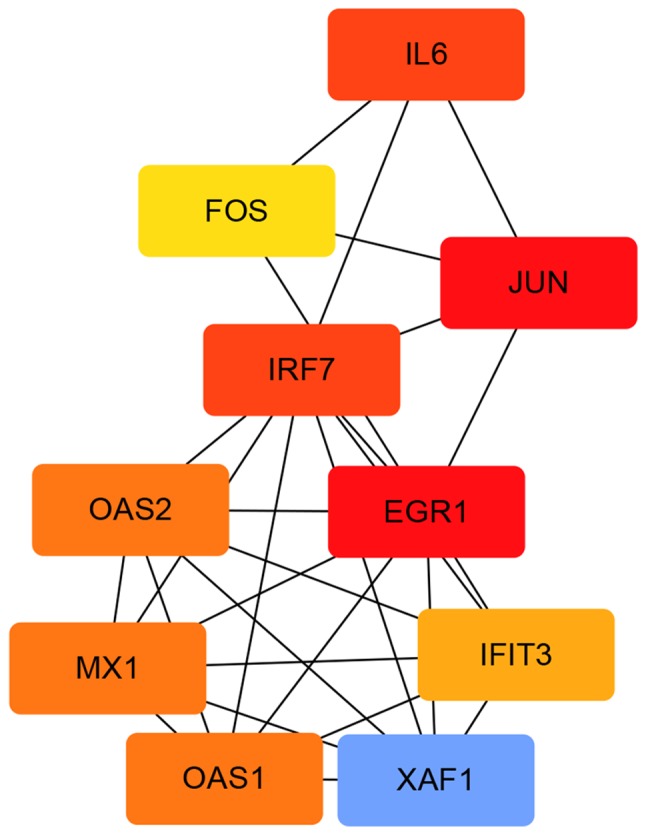
Figure 9.

Upregulated hub genes in the protein-protein interaction network. The different colors represent the difference in significance of the hub genes, in terms of their degree of connectivity. An increased shade gradient indicates a more notable association with other genes.
