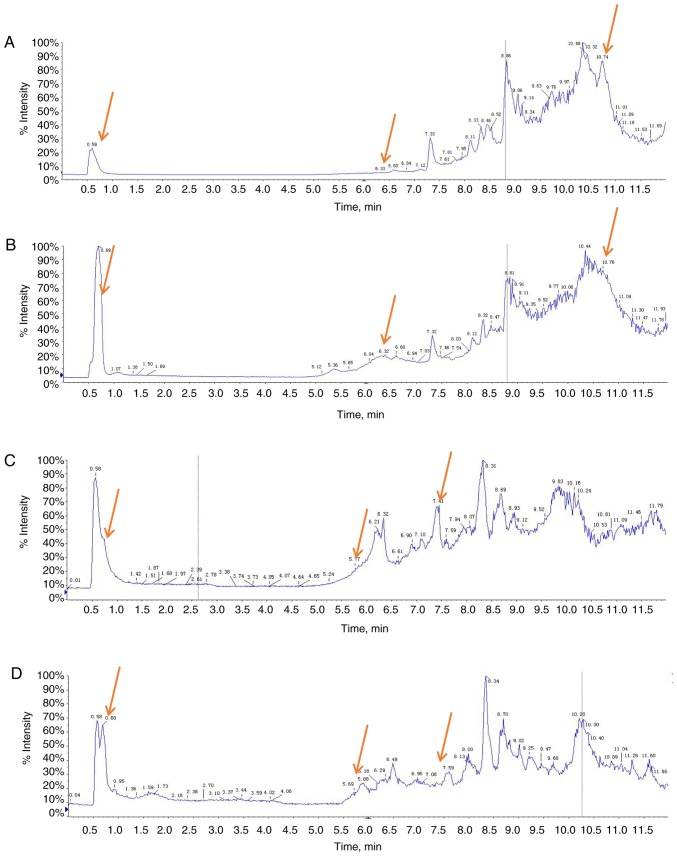
Figure 1.
TIC chromatograms of metabolites in the sera of four representative patients with gastric cancer in the training group. (A) TIC profiles of chemo-sensitive in the positive ion mode; (B) TIC profiles of chemo-resistant in the positive ion mode. (C) TIC profiles of chemo-sensitive in the negative ion mode; (D) TIC profiles of chemo-resistant in the negative ion mode. Red arrows indicate metabolites subsequently identified as having different abundances in the two groups. TIC, total ion current.

