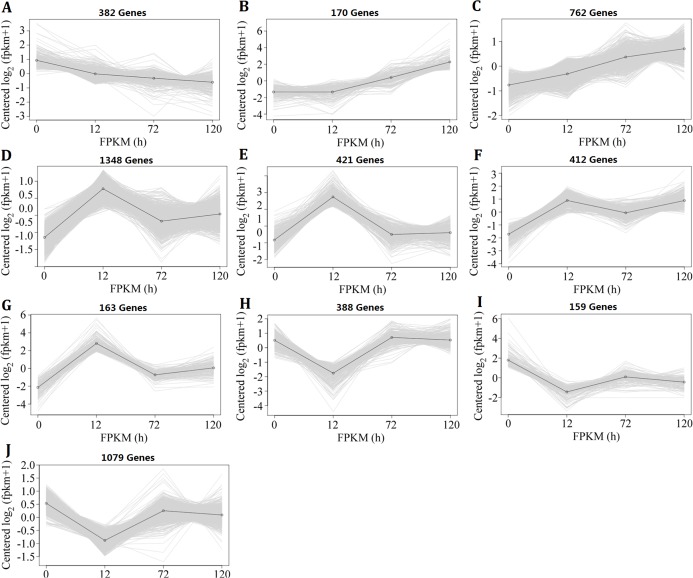
Figure 3. Expression patterns of the differentially expressed genes in hybrid rice (II8) flag leaves after different durations of heat-stress.
The vertical axis represents the gene expression signal values centered on log2 (fragments per kilobase per million +1), and the horizontal axis represents the four sample times (0 h, 24 h, 72 h, 120 h). (A) Genes in Cluster A were continuously down-regulated. (B and C) Genes in Clusters B and C were continuously up-regulated. (D–G) Genes in Clusters D–G showed early up-regulation and then partial decrease. (H–J) Genes in Clusters H–J showed early down-regulation before reversion.

